Kuliah Statistika Terapan - Pemusatan Data Sesi 2 Ep.04
Summary
TLDRThis video tutorial delves into statistical concepts, focusing on quartiles, deciles, and percentiles. It explains how to divide datasets into four, ten, or one hundred equal parts, respectively, through clear definitions and step-by-step calculations for both ungrouped and grouped data. Key formulas are presented alongside practical examples, enhancing understanding of how to determine the position and value of each statistical measure. The session aims to equip viewers with essential skills for data analysis, fostering a deeper comprehension of data distribution.
Takeaways
- 😀 Quartiles divide a sorted data set into four equal parts, with three quartiles (Q1, Q2, Q3) representing the divisions.
- 📊 To find quartiles, first sort the data, then calculate the position using the formula K = (n + 1) / 4, where K is the quartile number and n is the total number of data points.
- 🔍 For ungrouped data, after determining the positions, the actual quartile values can be found by averaging the appropriate data points.
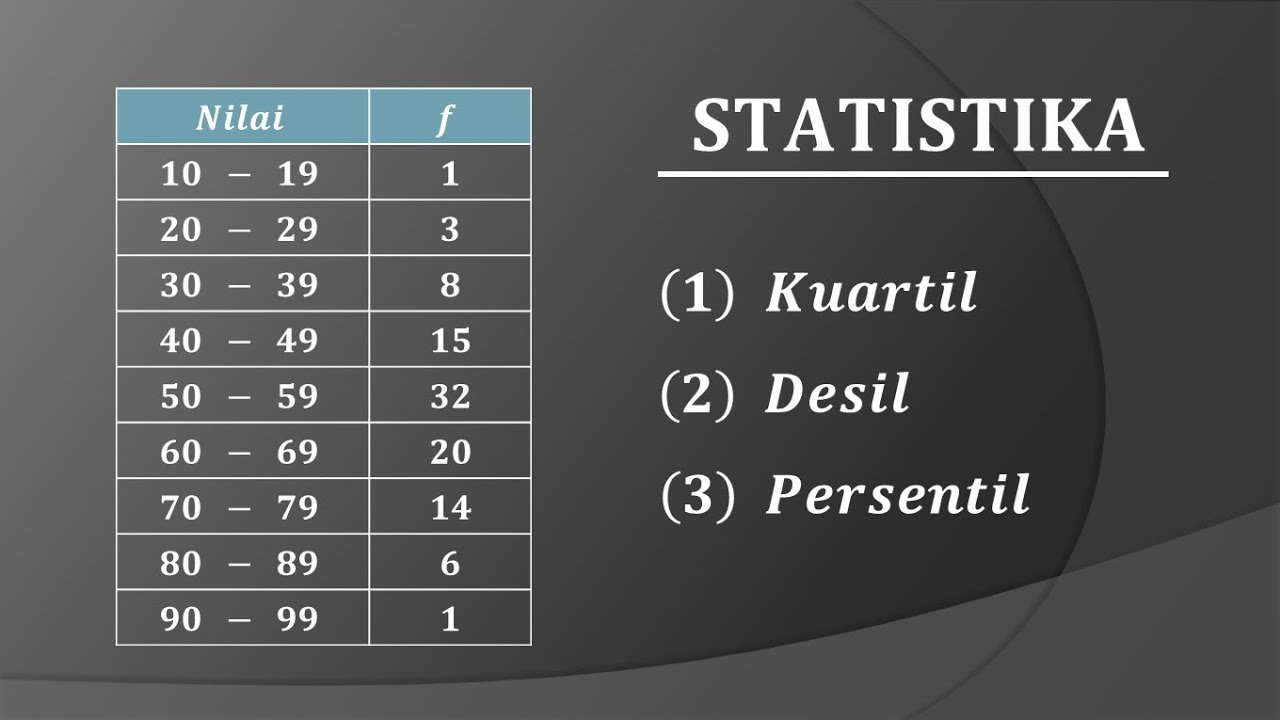
- 📈 For grouped data, the quartiles can be calculated directly using formulas that involve the cumulative frequency and class intervals, without sorting.
- 📏 Desiles are similar to quartiles but divide data into ten equal parts, using a similar approach to calculate positions and values.
- 📊 Percentiles divide data into 100 equal parts, and the process to find their positions and values is analogous to that of quartiles and desiles.
- 🔗 For grouped data, you do not need to sort the data; just use the frequency table to find the position of the desired percentile or desile.
- 📉 The formulas for finding quartiles, desiles, and percentiles differ only in the number of divisions they create (4, 10, and 100, respectively).
- 📚 The lecture emphasized the importance of understanding how to calculate quartiles, desiles, and percentiles for both grouped and ungrouped data.
- 👍 The session concluded with encouragement to apply these concepts to practical examples to reinforce understanding.
Q & A
What is a quartile, and how does it divide data?
-A quartile is a statistical term that refers to values that divide a sorted dataset into four equal parts. There are three quartiles in a dataset: Q1, Q2 (the median), and Q3, which help to understand the distribution of the data.
How do you find the position of the first quartile (Q1)?
-To find the position of Q1, use the formula K = (n + 1) / 4, where K is the quartile number (1 for Q1), and n is the number of data points. For example, if there are 9 data points, the position of Q1 would be (9 + 1) / 4 = 2.5, indicating it lies between the 2nd and 3rd data points.
What are the steps to calculate quartiles for ungrouped data?
-First, arrange the data in ascending order. Next, determine the position of each quartile using the relevant formulas. Finally, calculate the quartile values by interpolating between the data points as necessary.
What is the difference between calculating quartiles for grouped data versus ungrouped data?
-For grouped data, you don't need to sort the data. Instead, you directly find the position using the formulas based on the cumulative frequency. Additionally, you'll use the class boundaries and frequencies to calculate the quartile values.
Can you explain how to calculate the first quartile (Q1) for grouped data?
-To find Q1 for grouped data, first calculate its position using the formula Q1 = (1/4) * n, where n is the total number of observations. Then, identify the interval that contains Q1 and use the lower boundary, interval width, and cumulative frequency to compute the quartile value.
What are deciles, and how do they differ from quartiles?
-Deciles are values that divide a dataset into ten equal parts, resulting in nine dividing points. Unlike quartiles, which create four segments, deciles provide more granularity by segmenting data into smaller parts.
How do you find the position of the 4th decile (D4)?
-To find D4, use the formula Dk = (k * n + 1) / 10, where k is the decile number. For D4, this would be D4 = (4 * n + 1) / 10. After calculating the position, identify which data points it lies between.
What is a percentile, and how is it different from quartiles and deciles?
-A percentile is a measure that indicates the value below which a given percentage of observations fall. While quartiles divide data into four parts and deciles into ten, percentiles can divide data into one hundred parts, allowing for finer distinctions within the data.
How can you find the 20th percentile (P20) in ungrouped data?
-First, sort the data in ascending order. Then, use the formula Pk = (k * n + 1) / 100, where k is the desired percentile. For P20, calculate its position, and then determine its value by interpolating between the relevant data points.
What is the significance of knowing quartiles, deciles, and percentiles in data analysis?
-Understanding quartiles, deciles, and percentiles helps analysts summarize and interpret data distributions, identify outliers, and make comparisons among different datasets, which is essential for effective decision-making.
Outlines

This section is available to paid users only. Please upgrade to access this part.
Upgrade NowMindmap

This section is available to paid users only. Please upgrade to access this part.
Upgrade NowKeywords

This section is available to paid users only. Please upgrade to access this part.
Upgrade NowHighlights

This section is available to paid users only. Please upgrade to access this part.
Upgrade NowTranscripts

This section is available to paid users only. Please upgrade to access this part.
Upgrade NowBrowse More Related Video

CARA MENCARI NILAI KUARTIL DESIL PERSENTIL UKURAN LETAK II DATA TUNGGAL
STATISTIKA : Cara mudah menentukan nilai Quartil Desil dan Persentil data kelompok
Percentiles, Quantiles and Quartiles in Statistics | Statistics Tutorial | MarinStatsLectures

MEASURES OF POSITION FOR UNGROUPED DATA
Ukuran Penyebaran Data : Kuartil, Desil dan Persentil + Contoh Soal

UKURAN PEMUSATAN DATA BERKELOMPOK | Rataan Median Modus Kuartil Desil Persentil
5.0 / 5 (0 votes)