MEASURES OF POSITION FOR UNGROUPED DATA
Summary
TLDRThis video tutorial provides an in-depth explanation of key statistical measures, including deciles, percentiles, quartiles, and interquartile ranges. It covers how to divide data into equal parts using these measures and how to compute their positions in a data set using formulas. Through clear examples, the video demonstrates how to arrange data, calculate quartiles, deciles, and percentiles, and explains the concept of percentile rank. The tutorial is ideal for learners seeking to understand data distribution and the importance of these measures in analyzing and interpreting quantitative data.
Takeaways
- 😀 Measures of position like deciles, percentiles, and quartiles help determine where a score stands relative to others in a data set.
- 😀 Quantitative data, which falls on a numerical scale, can be used to calculate measures of position, and these can also apply to ordinal variables.
- 😀 Quartiles divide the data into four equal parts: first quartile (25%), second quartile (50%, also the median), and third quartile (75%).
- 😀 The interquartile range is the difference between the third quartile (upper quartile) and the first quartile, providing a measure of the spread of the middle 50% of the data.
- 😀 To compute quartiles, data must be ordered in ascending order first, then the median and quartiles can be identified.
- 😀 Deciles divide data into ten equal parts, with the fifth decile corresponding to the median (50%).
- 😀 When calculating deciles, if a value is not a whole number, the position is rounded to the next larger whole number and then averaged.
- 😀 Percentiles divide data into 100 equal parts, with the 50th percentile corresponding to the median. Percentile ranks help indicate the relative standing of a value within a data set.
- 😀 When calculating percentiles, the formula k * n / 100 is used, where 'k' is the desired percentile and 'n' is the number of data points.
- 😀 A percentile rank represents the percentage of values in a data set that fall below a given value, helping to understand the relative position of that value within the set.
- 😀 For instance, the 43rd percentile of a data set is found by multiplying 43 by the total number of data points, dividing by 100, and rounding to the nearest whole number if necessary.
Q & A
What are deciles and how are they used in ungrouped data?
-Deciles are score points that divide the distribution of data into 10 equal parts. They help in understanding how data is distributed and can be used to measure percentiles, such as the 10th, 20th, or 30th percentiles, which represent 10%, 20%, or 30% of the data.
What is the interquartile range and how is it calculated?
-The interquartile range (IQR) is the difference between the third quartile (Q3) and the first quartile (Q1) of a data set. It is calculated by subtracting Q1 from Q3, which gives the range within which the middle 50% of the data lies.
What are quartiles, and how are they divided in a data distribution?
-Quartiles are score points that divide a data distribution into four equal parts. The first quartile (Q1) marks the 25th percentile, the second quartile (Q2) is the median or 50th percentile, and the third quartile (Q3) marks the 75th percentile.
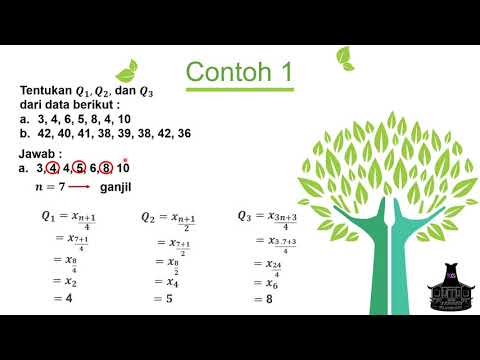
How do you calculate the first and third quartiles from a data set?
-To calculate the first (Q1) and third quartiles (Q3), arrange the data in ascending order. Q1 is the median of the lower half of the data, while Q3 is the median of the upper half. For odd numbers of data points, the median of each half is taken from the middle point.
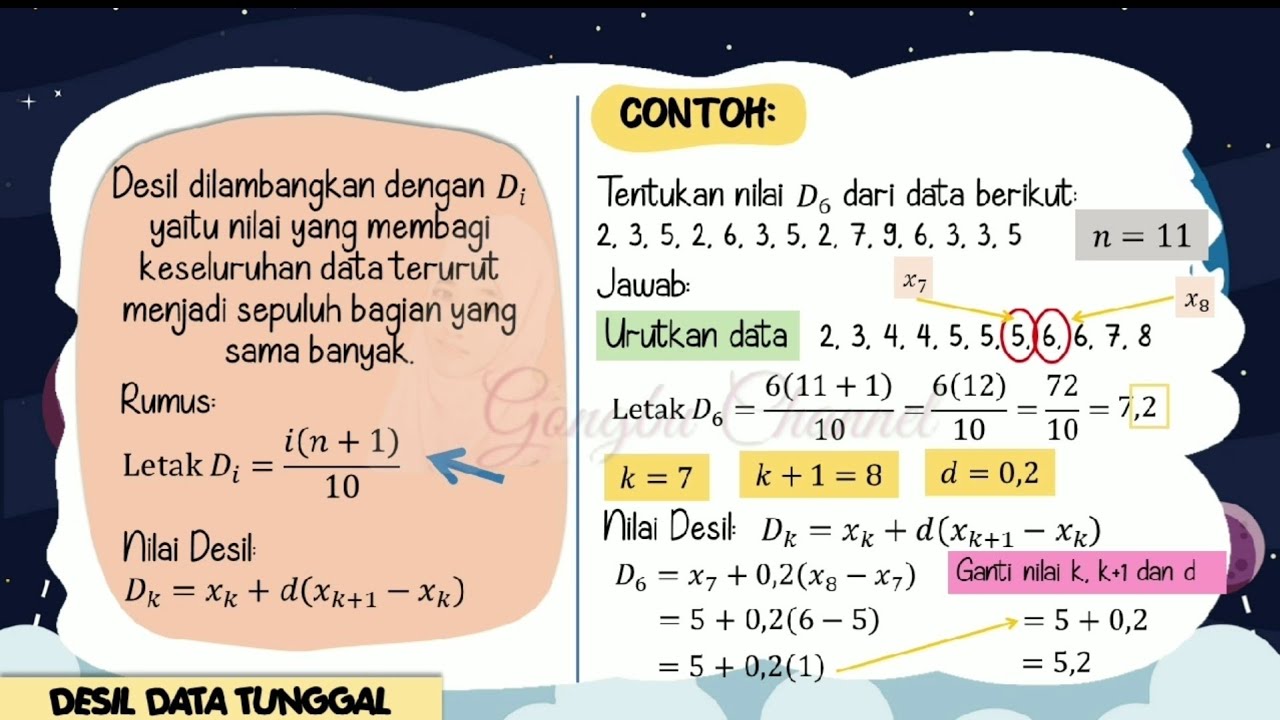
What is the method for calculating deciles when the position is not a whole number?
-If the position of a decile is not a whole number, you round up to the next whole number and calculate the average between the two data points at that position to find the decile value.
How is the second decile calculated from a set of test scores?
-The second decile (D2) is the score that marks the 20th percentile. To calculate it, you arrange the scores in ascending order, and then use the formula k times n over 10, where k is 2 for the second decile and n is the total number of scores.
What is the percentile rank, and how is it calculated for a given value?
-The percentile rank of a value is the percentage of values below it in the data set. It is calculated using the formula: (number of values below x + 0.5) / total number of values * 100.
What are percentiles, and how are they different from deciles?
-Percentiles are values that divide a data set into 100 equal parts, representing each percentage point from 1% to 100%. Unlike deciles, which divide the data into 10 parts, percentiles give a finer level of detail in terms of data distribution.
What steps are involved in calculating the percentile rank of a specific score in a set of data?
-To calculate the percentile rank, first arrange the data in ascending order. Then, count how many scores are below the target score, add 0.5 to that count, and divide by the total number of scores. Multiply the result by 100 to get the percentile rank.
How are the 60th and 75th percentiles computed from a data set?
-To calculate the 60th and 75th percentiles, multiply the percentile by the total number of data points, then divide by 100. If the resulting position is not a whole number, round it up to the next whole number and find the corresponding value, or average the two values surrounding it if necessary.
Outlines

This section is available to paid users only. Please upgrade to access this part.
Upgrade NowMindmap

This section is available to paid users only. Please upgrade to access this part.
Upgrade NowKeywords

This section is available to paid users only. Please upgrade to access this part.
Upgrade NowHighlights

This section is available to paid users only. Please upgrade to access this part.
Upgrade NowTranscripts

This section is available to paid users only. Please upgrade to access this part.
Upgrade NowBrowse More Related Video

Ukuran Penyebaran Data | Statistika Kelas 8

QUARTILES, DECILES AND PERCENTILES OF UNGROUPED DATA || GRADE 10 MATHEMATICS Q4
Ukuran Penyebaran Data : Kuartil, Desil dan Persentil + Contoh Soal

UKURAN PEMUSATAN DATA BERKELOMPOK | Rataan Median Modus Kuartil Desil Persentil
STATISTIKA : Cara mudah menentukan nilai Quartil Desil dan Persentil data kelompok
Ukuran Letak Data Tunggal (Kuartil, Desil dan Persentil)
5.0 / 5 (0 votes)