STATISTIKA : Cara mudah menentukan nilai Quartil Desil dan Persentil data kelompok
Summary
TLDRThis educational video tutorial demonstrates how to easily determine the values of quartiles, deciles, and percentiles for grouped data. It explains the step-by-step process, including calculating cumulative frequencies, identifying the correct classes for quartiles, deciles, and percentiles, and applying the appropriate formulas to compute the values. Using a practical example, the video clarifies how to work through the data systematically, ensuring viewers understand the methods clearly. The tutorial emphasizes the ease of performing these calculations, making statistical concepts more approachable and accessible.
Takeaways
- 😀 The video discusses how to easily determine quartiles, deciles, and percentiles for grouped data.
- 😀 The first step in the process is summing the frequencies and ensuring the total equals the number of data points (100 in this case).
- 😀 The next step is calculating the cumulative frequency (FK) by adding the frequencies progressively.
- 😀 The key formula for finding the position of Q2 (the second quartile) is 2/4 × N (where N is the total number of data points).
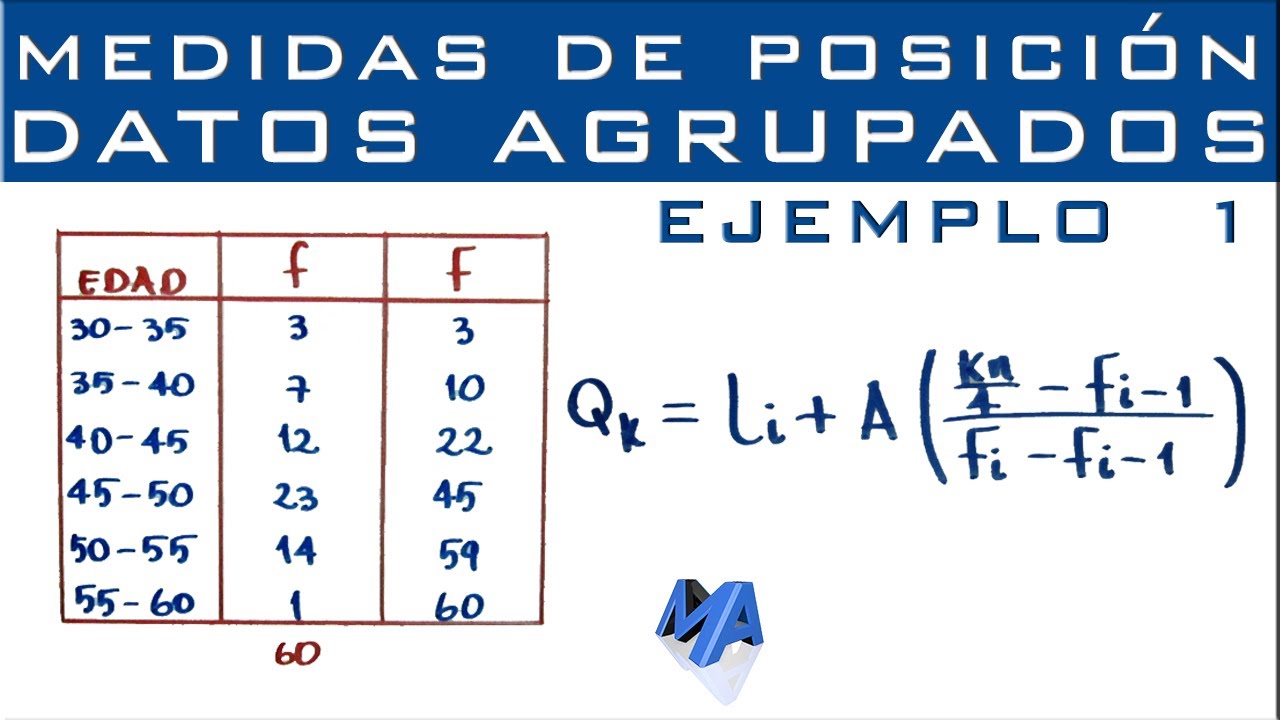
- 😀 After determining the class containing Q2, the formula for calculating its value is provided, involving the class width and cumulative frequencies.
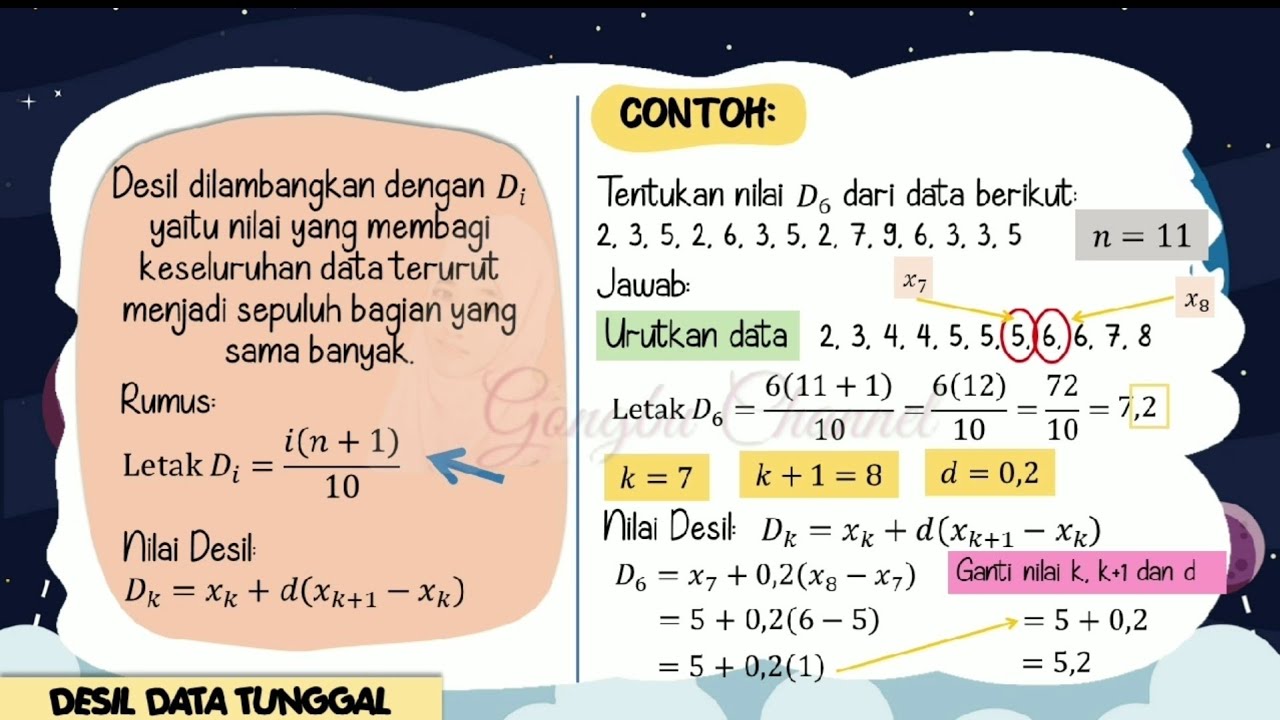
- 😀 The same method applies to finding deciles, such as D8, where the formula involves 8/10 × N to determine the position.
- 😀 For decile calculations, the class containing the desired decile is identified, and the value is calculated similarly to quartiles.
- 😀 The process for finding percentiles, such as P20, follows a similar approach to quartiles and deciles, with the formula 20/100 × N.
- 😀 The position of P20 is found in the class where data points between the 13th and 27th are located, and the value is calculated using the class boundaries and frequencies.
- 😀 The video emphasizes the simplicity of these calculations, explaining that the steps for quartiles, deciles, and percentiles are essentially the same, with slight variations in the formula.
- 😀 The tutorial concludes by wishing viewers that the content is beneficial and encouraging them to share the video for educational purposes.
Q & A
What is the first step in calculating quartiles, deciles, and percentiles from grouped data?
-The first step is to sum the frequencies in the data table. This total is represented by 'n' and ensures that all data points are accounted for.
How do you calculate the cumulative frequency (FK) for a data set?
-The cumulative frequency is calculated by adding the frequencies progressively from the top row to the bottom row, with each entry showing the total frequency up to that point.
What is the formula used to find the position of Q2 (the median)?
-The position of Q2 is found using the formula: Q2 position = (2/4) * n, where 'n' is the total frequency.
How do you determine the class interval where Q2 (the median) lies?
-Locate the class interval where the cumulative frequency exceeds the position of Q2. This class contains the median.
What is the formula for calculating the actual value of Q2 once its position is determined?
-Q2 is calculated using the formula: Q2 = Lower class boundary of Q2 + ((Q2 position - Cumulative frequency before Q2) / Frequency of Q2's class) * Class width.
What formula do you use to calculate the position of D8 (the 8th decile)?
-The position of D8 is calculated using the formula: D8 position = (8/10) * n, where 'n' is the total frequency.
How is the value of D8 determined once its class interval is found?
-The value of D8 is determined by using a similar formula as for Q2: D8 = Lower class boundary of D8 + ((D8 position - Cumulative frequency before D8) / Frequency of D8's class) * Class width.
What is the general formula for calculating any percentile (e.g., P20)?
-The general formula for calculating a percentile is: Percentile position = (Percentile / 100) * n. Then, the appropriate class interval is found, and the value is calculated similarly to Q2.
How do you determine the class interval where a specific percentile (e.g., P20) lies?
-You find the class interval where the cumulative frequency first exceeds the percentile position. For P20, this is the class interval where the cumulative frequency exceeds 20% of the total data.
Why do you subtract 0.5 from the lower class boundary when calculating the quartile, decile, or percentile?
-The subtraction of 0.5 from the lower class boundary is part of the standard formula to account for the exact position within the class interval, ensuring more accurate results.
Outlines

This section is available to paid users only. Please upgrade to access this part.
Upgrade NowMindmap

This section is available to paid users only. Please upgrade to access this part.
Upgrade NowKeywords

This section is available to paid users only. Please upgrade to access this part.
Upgrade NowHighlights

This section is available to paid users only. Please upgrade to access this part.
Upgrade NowTranscripts

This section is available to paid users only. Please upgrade to access this part.
Upgrade NowBrowse More Related Video

UKURAN PEMUSATAN DATA BERKELOMPOK | Rataan Median Modus Kuartil Desil Persentil

Statistika Bagian 6 - Persentil Data Tunggal dan Data Kelompok Matematika Wajib Kelas 12
Cuartiles, Deciles y Percentiles | Datos agrupados en intervalos | Ejemplo 1

MEASURES OF POSITION OF GROUPED DATA | MATHEMATICS IN THE MODERN WORLD
Ukuran Letak Data Tunggal (Kuartil, Desil dan Persentil)

CARA MENCARI NILAI KUARTIL DESIL PERSENTIL UKURAN LETAK II DATA TUNGGAL
5.0 / 5 (0 votes)