CARA MENCARI NILAI KUARTIL DESIL PERSENTIL UKURAN LETAK II DATA TUNGGAL
Summary
TLDRIn this educational video, Nur Haida explains how to calculate the position and value of quartiles, deciles, and percentiles in a data set. The video covers key concepts like the division of data into equal parts, and walks through methods and formulas for determining quartiles, deciles, and percentiles. Through practical examples, the video highlights the process of sorting data, applying interpolation when needed, and calculating the desired values. Aimed at making these statistical concepts accessible, the tutorial emphasizes understanding and applying formulas in real-life data analysis scenarios.
Takeaways
- 😀 The video aims to teach how to calculate the position of data in a set using quartiles, deciles, and percentiles.
- 😀 The goal of the lesson is to help viewers calculate quartiles, deciles, and percentiles for single data sets.
- 😀 Before learning, it's important to have a positive mindset: 'I can understand, and math is easy.'
- 😀 Quartiles divide a dataset into four equal parts, with three quartiles: Q1 (lower quartile), Q2 (median), and Q3 (upper quartile).
- 😀 To find quartiles, first, sort the data, then use the formula: Q_i = (i × n + 1) / 4, where 'i' is the quartile number and 'n' is the number of data points.
- 😀 For odd-numbered datasets, the first quartile (Q1), second quartile (Q2), and third quartile (Q3) can be directly identified after sorting the data.
- 😀 For even-numbered datasets, interpolation is required when the position of the quartile falls between two data points.
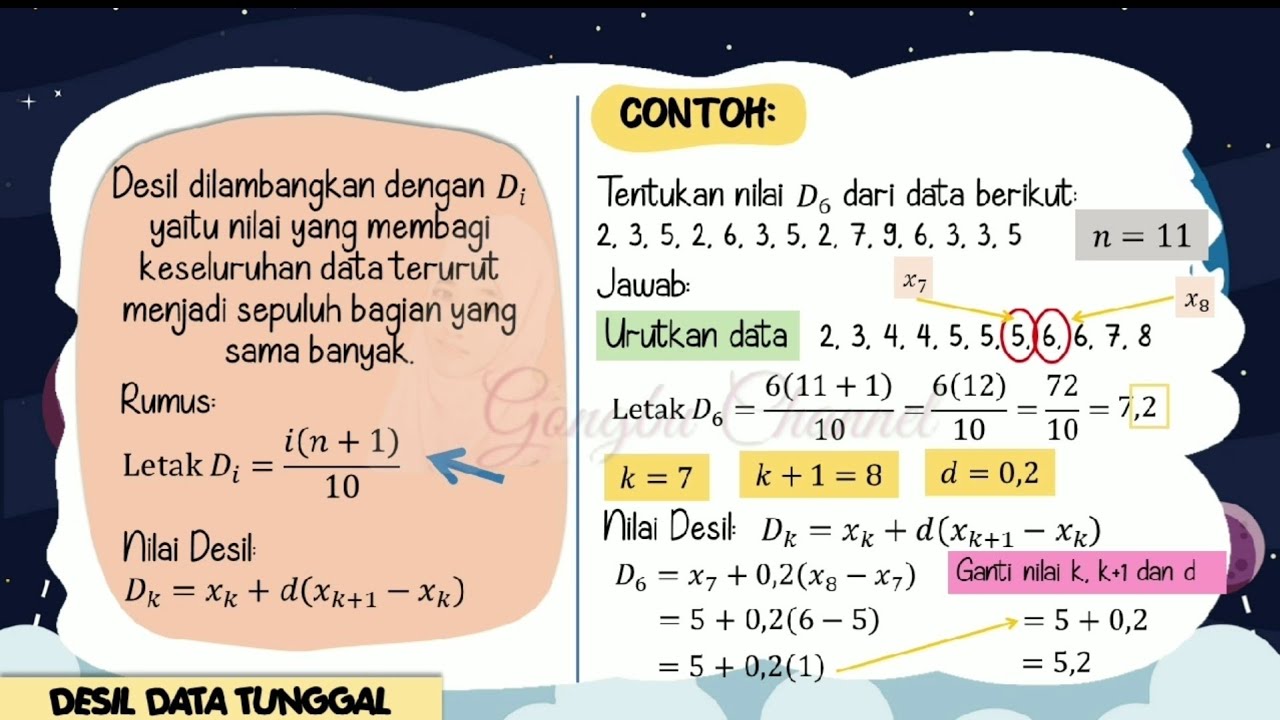
- 😀 Deciles divide a dataset into ten equal parts, and each decile is calculated using a formula similar to the quartile formula but divided by 10.
- 😀 Percentiles divide a dataset into 100 equal parts, with the position of each percentile calculated using a formula similar to quartiles and deciles.
- 😀 In all cases, when a calculated position is not an integer, interpolation between data points is necessary to find the exact value.
Q & A
What are location measures in statistics?
-Location measures are statistical metrics that help determine the position of a particular data point within a dataset that has been ordered. These include quartiles, deciles, and percentiles.
What is a quartile and how is it calculated?
-A quartile is a value that divides a data set into four equal parts. To calculate a quartile, the data must first be ordered, then the position of the quartiles is determined using the formula: (i * n + 1) / 4, where i is the quartile number (1, 2, or 3) and n is the number of data points.
How is the first quartile (Q1) interpreted in a dataset?
-The first quartile (Q1) represents the value that divides the lowest 25% of the data from the remaining 75%. It is found using the first quartile formula and the position of the value within the ordered data.
What is the role of interpolation in calculating quartiles?
-Interpolation is used when the position of a quartile or other location measure falls between two data points. This allows for the calculation of an estimated value based on the surrounding data.
What is the difference between quartile calculations for odd and even numbers of data points?
-For an odd number of data points, the quartiles are typically found directly at specific data points. For an even number of data points, interpolation is necessary to find the exact position of the quartiles, as they fall between data values.
What is a decile and how does it differ from a quartile?
-A decile divides the data into ten equal parts, unlike quartiles, which divide the data into four parts. The method for calculating deciles is similar to quartiles, but with a divisor of 10 instead of 4 in the formula.
How do you calculate the second decile (D2)?
-To calculate the second decile (D2), you use the formula: D2 = (2 * n + 1) / 10, where n is the total number of data points. The result is the position of D2 within the ordered dataset. If the result is not a whole number, interpolation is used to find its exact value.
What are percentiles and how are they calculated?
-Percentiles are values that divide the data into 100 equal parts. To calculate the value of a specific percentile, you use the formula: (i * n + 1) / 100, where i is the percentile number (1-99), and n is the number of data points. Similar to quartiles and deciles, interpolation may be required if the result is a decimal.
What is the significance of the 90th percentile in a dataset?
-The 90th percentile indicates the value below which 90% of the data points fall. It is useful for understanding the upper range of a dataset and can highlight the top 10% of values in terms of their distribution.
Why is it important to sort the data before calculating location measures like quartiles, deciles, and percentiles?
-Sorting the data is essential because location measures are based on the ordered position of data points. Without sorting, the calculations for quartiles, deciles, and percentiles would be inaccurate and meaningless.
Outlines

This section is available to paid users only. Please upgrade to access this part.
Upgrade NowMindmap

This section is available to paid users only. Please upgrade to access this part.
Upgrade NowKeywords

This section is available to paid users only. Please upgrade to access this part.
Upgrade NowHighlights

This section is available to paid users only. Please upgrade to access this part.
Upgrade NowTranscripts

This section is available to paid users only. Please upgrade to access this part.
Upgrade NowBrowse More Related Video

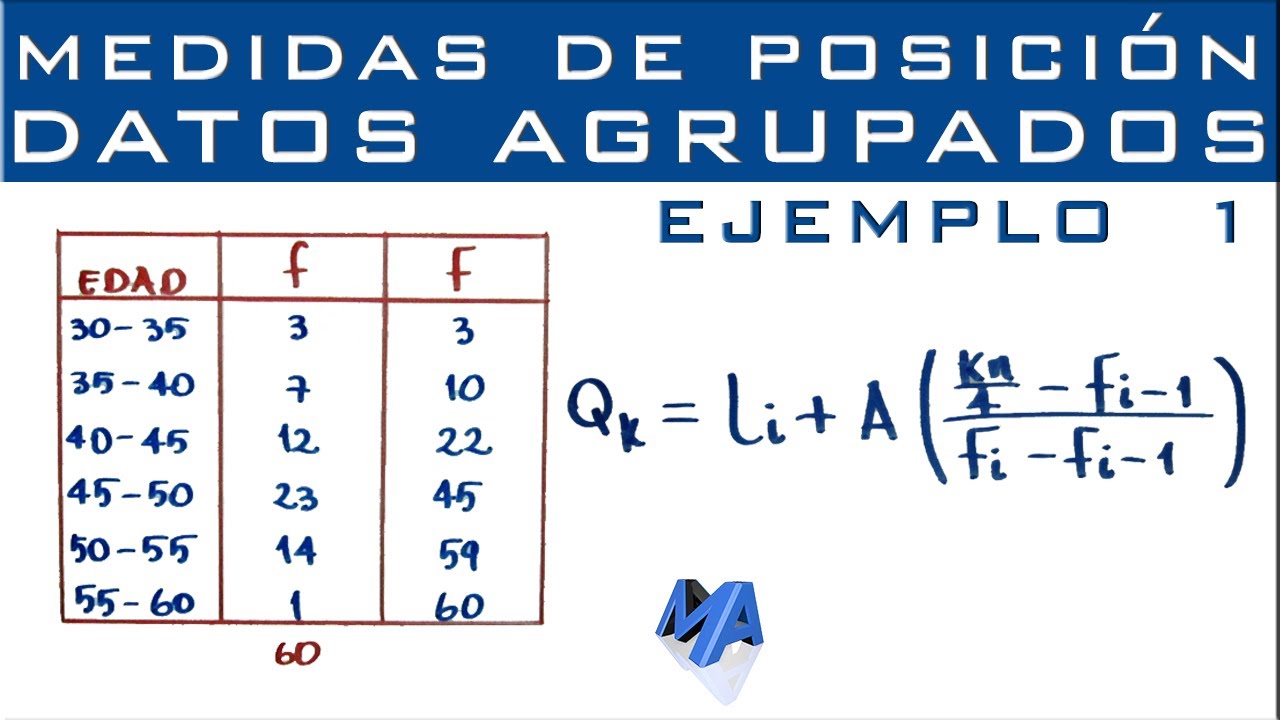
MEASURES OF POSITION OF GROUPED DATA | MATHEMATICS IN THE MODERN WORLD
Ukuran Letak Data Tunggal (Kuartil, Desil dan Persentil)

MEASURES OF POSITION FOR UNGROUPED DATA
Cuartiles, Deciles y Percentiles | Datos agrupados en intervalos | Ejemplo 1

QUARTILES, DECILES AND PERCENTILES OF UNGROUPED DATA || GRADE 10 MATHEMATICS Q4

Statistika Bagian 6 - Persentil Data Tunggal dan Data Kelompok Matematika Wajib Kelas 12
5.0 / 5 (0 votes)