UKURAN PEMUSATAN DATA BERKELOMPOK | Rataan Median Modus Kuartil Desil Persentil
Summary
TLDRIn this educational video, the presenter explains how to calculate measures of central tendency (mean, median, mode, quartiles, percentiles, and deciles) for grouped data. Using real-life examples, particularly focusing on data related to coronary heart disease patients, the video demonstrates step-by-step calculations for these statistical measures, including formulae and practical applications. The tutorial covers the process of computing the mean, median, mode, and quartiles, alongside detailed explanations of how these measures divide data into meaningful segments. Aimed at helping viewers understand and apply statistical methods in grouped data scenarios.
Takeaways
- 😀 The video explains measures of central tendency for grouped data, focusing on how to calculate mean, median, mode, quartiles, percentiles, and deciles.
- 😀 Central tendency measures help identify the center of a dataset, such as mean, median, and mode, which are calculated differently for grouped data.
- 😀 Grouped data consists of intervals with equal class widths, and the data is summarized in a frequency distribution table.
- 😀 The mean for grouped data is calculated by multiplying the midpoint of each class by its frequency, summing these products, and dividing by the total number of observations.
- 😀 The median is the value that divides the dataset into two equal halves and can be calculated using a specific formula involving class boundaries and frequencies.
- 😀 To calculate the mode for grouped data, you need to determine the class with the highest frequency and apply a formula involving the frequencies of adjacent classes.
- 😀 Quartiles divide the dataset into four equal parts, and the first (Q1) and third (Q3) quartiles can be found using similar methods to the median calculation.
- 😀 Deciles divide the dataset into ten equal parts, and they are calculated similarly to quartiles, but with the position adjusted for the 10 parts.
- 😀 Percentiles divide the dataset into 100 equal parts, and specific percentiles (like the 10th percentile) are calculated using a formula similar to those for quartiles and deciles.
- 😀 The video emphasizes the importance of understanding the positions of values in grouped data, especially for calculating median, quartiles, deciles, and percentiles.
Q & A
What is meant by 'measuring central tendency' in statistics?
-Measuring central tendency refers to methods used to identify the central point or typical value of a data set. These measures include mean, median, mode, quartiles, percentiles, and deciles.
What is grouped data?
-Grouped data is data that is presented in the form of intervals or classes. Each class represents a range of values, and the frequency of each class is recorded. Grouped data is often used when dealing with large data sets.
How do you calculate the mean of grouped data?
-To calculate the mean of grouped data, multiply the midpoint of each class (Emi) by the frequency of the class (Evi), sum the results, and then divide by the total number of observations (n). The formula is: x̄ = Σ(Emi × Evi) / n.
How do you find the midpoint of a class interval?
-The midpoint (Emi) of a class interval is calculated by adding the lower and upper boundaries of the interval and dividing by two. For example, for the class interval 41-48, the midpoint is (41 + 48) / 2 = 44.5.
What is the median in grouped data?
-The median is the value that divides the data set into two equal parts. In grouped data, it is found using the formula: Median = L0 + [(n/2 - ΣF0) / Fm] × C, where L0 is the lower boundary of the median class, n is the total number of observations, ΣF0 is the cumulative frequency before the median class, Fm is the frequency of the median class, and C is the class width.
How do you calculate the median from a frequency table?
-To calculate the median from a frequency table, first find the class interval where the median lies, then apply the formula for the median, considering the lower boundary, cumulative frequency, class width, and the frequency of the median class.
What is the mode of grouped data?
-The mode is the value that appears most frequently in a data set. For grouped data, the mode is calculated using the formula: Mode = L0 + [(F1 - F0) / (2F1 - F0 - F2)] × C, where L0 is the lower boundary of the modal class, F1 is the frequency of the modal class, F0 is the frequency of the class before the modal class, F2 is the frequency of the class after the modal class, and C is the class width.
What are quartiles in statistics?
-Quartiles divide a data set into four equal parts. Q1 is the first quartile (25th percentile), Q2 is the median (50th percentile), and Q3 is the third quartile (75th percentile). Quartiles are useful for understanding the distribution of data.
What is the difference between deciles and percentiles?
-Deciles divide a data set into ten equal parts, while percentiles divide it into one hundred equal parts. Deciles are used to analyze the distribution of data in larger chunks, while percentiles provide more detailed insights into the data.
How do you calculate the first quartile (Q1) for grouped data?
-To calculate Q1 for grouped data, first determine the class interval where Q1 lies (which is at the 25th percentile). Then, apply the quartile formula: Q1 = L0 + [(n/4 - ΣF0) / FQ1] × C, where L0 is the lower boundary of the Q1 class, ΣF0 is the cumulative frequency before Q1, FQ1 is the frequency of the Q1 class, and C is the class width.
Outlines

This section is available to paid users only. Please upgrade to access this part.
Upgrade NowMindmap

This section is available to paid users only. Please upgrade to access this part.
Upgrade NowKeywords

This section is available to paid users only. Please upgrade to access this part.
Upgrade NowHighlights

This section is available to paid users only. Please upgrade to access this part.
Upgrade NowTranscripts

This section is available to paid users only. Please upgrade to access this part.
Upgrade NowBrowse More Related Video
03. Cómo describir una variable numérica | Curso de SPSS
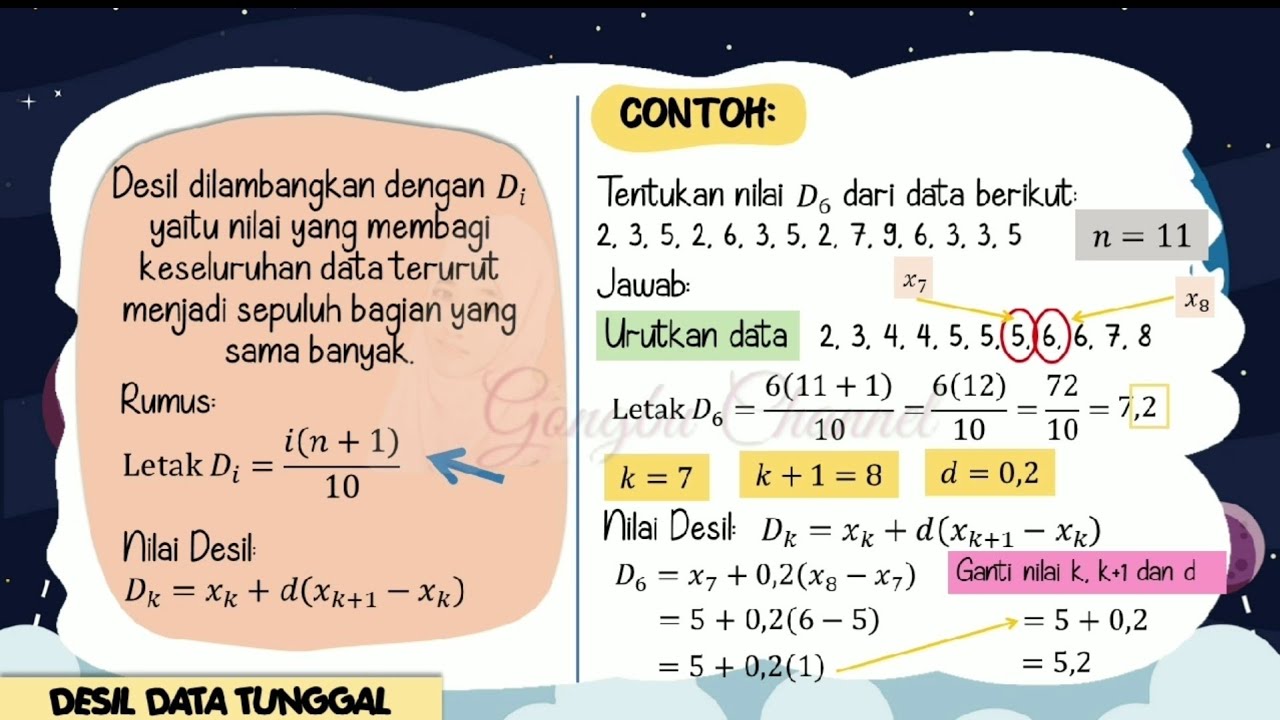
Ukuran Letak Data Tunggal (Kuartil, Desil dan Persentil)
Ukuran Pemusatan Data Kelompok

Statistika Dasar Ukuran Pemusatan Data (Mean, Modus, Median) Data Tunggal dan Data Kelompok

Kuliah Statistika Terapan - Pemusatan Data Sesi 1 Ep.04
KULIAH STATISTIK (5) - UKURAN PEMUSATAN DATA
5.0 / 5 (0 votes)