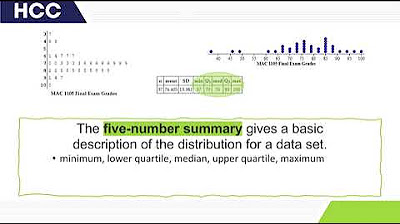
Statistics Grade 10: Quartiles
Summary
TLDRThis lesson focuses on the concepts of lower and upper quartiles, median, and range in data analysis. The instructor demonstrates how to arrange data in ascending order and calculate the lower quartile (Q1) as the median of the lower half of the data set, resulting in 4.5. The upper quartile (Q3) is similarly found as the median of the upper half, yielding 9. The range is defined as the difference between the highest and lowest data values, which is 9 in this case. The interquartile range (IQR) is the difference between Q3 and Q1, calculated to be 4.5. The video also introduces a mathematical method to determine quartile positions using the formula (n+1)/4 for Q1 and 3*((n+1)/4) for Q3, where n is the number of data points.
Takeaways
- 📝 Always arrange data values from smallest to largest before calculating quartiles.
- 🔢 The lower quartile (Q1) is the median of the lower half of the data.
- 📌 To find the median, cross off an equal number of values from both ends until the middle value is reached.
- 🧩 For an odd number of data points, the median is the middle value after sorting.
- 📊 The upper quartile (Q3) is the median of the upper half of the data.
- 📘 The range of a data set is the difference between the highest and lowest values.
- 📈 A more mathematical approach to find quartiles involves using the formula (n + 1) / 4 for Q1 and 3 * (n + 1) / 4 for Q3, where n is the number of data points.
- 🔍 When the result of the quartile formula is not a whole number, interpolate between the two closest data points.
- 📐 The interquartile range (IQR) is calculated by subtracting Q1 from Q3.
- 📝 The IQR is a measure of statistical dispersion and is equal to the range of the middle 50% of the data.
- 📚 Understanding quartiles and the IQR helps in analyzing the distribution of data and identifying potential outliers.
Q & A
What is the purpose of arranging data from smallest to biggest?
-Arranging data from smallest to biggest is important for identifying statistical measures such as the median, quartiles, and range, which require the data to be in a specific order.
What is the definition of the lower quartile (Q1)?
-The lower quartile, or Q1, is the median of the lower half of the data set, representing the middle value of the lower 50% of the data.
How do you find the median of a data set?
-To find the median, arrange the data in ascending order and identify the middle number. If there is an even number of data points, the median is the average of the two middle numbers.
What is the formula for calculating the position of the lower quartile (Q1)?
-The position of Q1 can be calculated using the formula (n + 1) / 4, where n is the total number of data points.
How do you find the value of Q1 when there are two numbers at the calculated position?
-When there are two numbers at the calculated position for Q1, you take the average of these two numbers to find the value of Q1.
What is the definition of the upper quartile (Q3)?
-The upper quartile, or Q3, is the median of the upper half of the data set, representing the middle value of the upper 50% of the data.
How do you calculate the position of the upper quartile (Q3)?
-The position of Q3 is calculated using the formula 3 * ((n + 1) / 4), where n is the total number of data points.
What is the range of a data set?
-The range of a data set is the difference between the highest and lowest values, indicating the spread of the data.
What is the interquartile range (IQR) and how is it calculated?
-The interquartile range (IQR) is the range of the middle 50% of the data, calculated by subtracting Q1 from Q3 (IQR = Q3 - Q1).
Why is the interquartile range (IQR) a useful statistical measure?
-The IQR is useful because it gives an idea of the spread of the middle 50% of the data, which can be helpful in identifying outliers and understanding data distribution.
What does it mean if the IQR is large?
-A large IQR indicates that the middle 50% of the data is spread out over a wide range, suggesting possible outliers or a non-normal distribution.
Outlines

Cette section est réservée aux utilisateurs payants. Améliorez votre compte pour accéder à cette section.
Améliorer maintenantMindmap

Cette section est réservée aux utilisateurs payants. Améliorez votre compte pour accéder à cette section.
Améliorer maintenantKeywords

Cette section est réservée aux utilisateurs payants. Améliorez votre compte pour accéder à cette section.
Améliorer maintenantHighlights

Cette section est réservée aux utilisateurs payants. Améliorez votre compte pour accéder à cette section.
Améliorer maintenantTranscripts

Cette section est réservée aux utilisateurs payants. Améliorez votre compte pour accéder à cette section.
Améliorer maintenantVoir Plus de Vidéos Connexes
5.0 / 5 (0 votes)


