Kurikulum Merdeka Matematika Kelas 8 Bab 6 Statistika
Summary
TLDRThis video explains key statistical concepts for 8th-grade math, focusing on mode, median, mean, range, and quartiles. It starts by defining the mode and how to identify it, followed by a clear explanation of median, including the steps to find it for both odd and even data sets. The video also covers the mean, demonstrating the formulas for calculating the average, and discusses the range as the difference between the highest and lowest values. Lastly, it touches on quartiles and how to divide data into four parts. The video is educational and aimed at helping students understand these statistical concepts.
Takeaways
- 😀 Mode is the most frequently occurring number in a dataset. To find it, simply look for the value that appears the most.
- 😀 If there are two or more numbers that occur most frequently, list all of them as the mode.
- 😀 Median is the middle value in a dataset when arranged in ascending or descending order. If the number of data points is odd, the median is the middle number.
- 😀 When the number of data points is even, the median is the average of the two middle numbers.
- 😀 Mean (average) is calculated by adding all values in a dataset and dividing the sum by the number of values.
- 😀 For datasets with a frequency distribution, use the weighted mean formula to account for the frequencies of values.
- 😀 Range is the difference between the highest and lowest values in a dataset. It shows the spread of the data.
- 😀 Quartiles divide the data into four equal parts. Q1 is the 25th percentile, Q2 is the median (50th percentile), and Q3 is the 75th percentile.
- 😀 When calculating the mean, always be careful with the numbers to avoid calculation mistakes, especially with large datasets.
- 😀 Remember to arrange the data in order before calculating the median or quartiles. This is essential for accurate results.
Q & A
What is the modus in statistics?
-Modus is the value that appears most frequently in a data set. It helps identify the most common data point.
How do you find the modus in a given set of numbers?
-To find the modus, you simply identify the number that appears the most often. For example, in the set 60, 75, 75, 75, 80, 90, 80, 55, 65, the modus is 75 because it appears three times.
What happens if two numbers have the same highest frequency in a data set?
-If two or more numbers appear the same number of times, list all of them as the modus. For example, in a set where both 65 and 75 appear three times, the modus would be 65 and 75.
What is the median in statistics?
-The median is the middle value in a data set when the numbers are arranged in order. If the data set has an odd number of values, the median is the middle value. If it has an even number, the median is the average of the two middle values.
How do you calculate the median if the data set has an odd number of values?
-If the data set has an odd number of values, the median is simply the number that falls in the middle of the sorted data. For example, for the data set 60, 70, 75, 80, 85, the median is 75.
How do you calculate the median if the data set has an even number of values?
-If the data set has an even number of values, find the two middle numbers, add them together, and divide by 2. For example, for the data set 60, 70, 75, 80, the median is (70 + 75) / 2 = 72.5.
What is the mean in statistics?
-The mean is the average of a data set, calculated by adding all the values together and dividing by the total number of values.
How do you calculate the mean of a data set?
-To calculate the mean, add all the data points together and divide by the number of data points. For example, with the scores 60, 70, 75, 80, and 90, the mean is (60 + 70 + 75 + 80 + 90) / 5 = 75.
What is the range in statistics?
-The range is the difference between the largest and smallest values in a data set. It helps to understand the spread of the data.
How do you calculate the range of a data set?
-To calculate the range, subtract the smallest value from the largest value. For example, if the data set is 50, 60, 70, 80, and 100, the range is 100 - 50 = 50.
Outlines

This section is available to paid users only. Please upgrade to access this part.
Upgrade NowMindmap

This section is available to paid users only. Please upgrade to access this part.
Upgrade NowKeywords

This section is available to paid users only. Please upgrade to access this part.
Upgrade NowHighlights

This section is available to paid users only. Please upgrade to access this part.
Upgrade NowTranscripts

This section is available to paid users only. Please upgrade to access this part.
Upgrade NowBrowse More Related Video
Matematika Kelas 8: Statistika | Mean, Median, Modus, Kuartil, Jangkauan

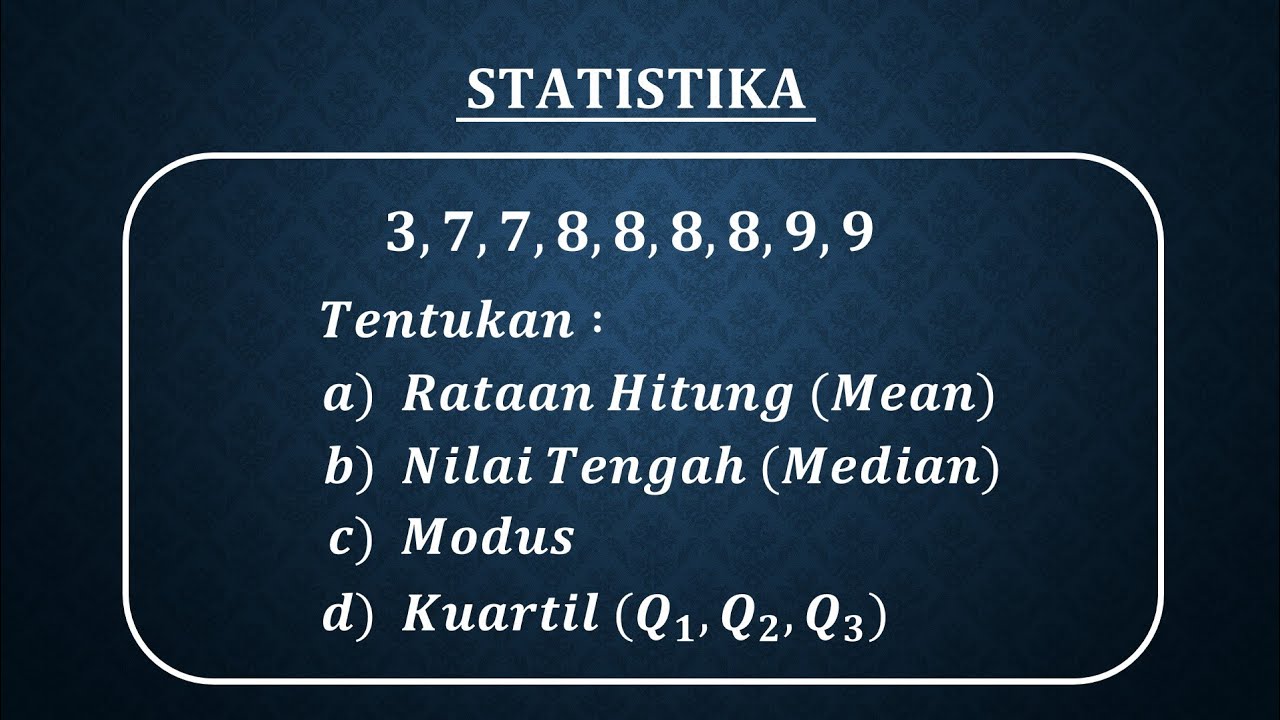
Ukuran Pemusatan Data (Mean, Median, Modus dan Kuartil) - STATISTIKA Kelas 8

Menentukan Kuartil Q1 Q2 Q3 Median Mean Modus Statistika kelas 12

UKURAN PEMUSATAN DATA BERKELOMPOK | Rataan Median Modus Kuartil Desil Persentil
STATISTIKA Tentang Mean, Median, Modus dan Kuartil Data Tunggal
STATISTIKA (MEAN,MEDIAN,MODUS DAN STATISTK LIMA SERANGKAI)
5.0 / 5 (0 votes)