Interquartile Range (IQR) | Math with Mr. J
Summary
TLDRIn this video, the presenter explains how to find the interquartile range (IQR) of a data set. The IQR measures the spread of the middle 50% of the data, unlike the range which considers the entire data set. Two examples are provided: one with an odd number of values and another with an even number. Key steps include arranging data in ascending order, finding the median, and determining the lower and upper quartiles. The IQR is calculated by subtracting the lower quartile from the upper quartile. Visual aids help viewers better understand the concept.
Takeaways
- 😀 The interquartile range (IQR) represents the spread of the middle 50% of a data set, which is different from the overall range that includes all data points.
- 😀 To find the IQR, first arrange the data in ascending order from least to greatest.
- 😀 The median (Q2) divides the data into two halves and is the starting point for finding quartiles.
- 😀 For an odd number of data points, the median is the middle number, with equal numbers on both sides.
- 😀 Quartile 1 (Q1) is the median of the lower half of the data set, while Quartile 3 (Q3) is the median of the upper half.
- 😀 The IQR is calculated by subtracting the lower quartile (Q1) from the upper quartile (Q3).
- 😀 In the first example, with 7 numbers, the IQR was 18, found by subtracting 32 (Q1) from 50 (Q3).
- 😀 In the second example, with 10 numbers, the median is found by averaging the two middle numbers (8 and 11), giving a median of 9.5.
- 😀 The lower quartile (Q1) is 6 and the upper quartile (Q3) is 14 in the second example, resulting in an IQR of 8.
- 😀 Visualizing the data with lines for the median, lower quartile, and upper quartile helps understand the distribution and IQR of the data.
- 😀 Understanding quartiles and IQR is useful for analyzing the spread and variability of data within a set.
Q & A
What is the interquartile range?
-The interquartile range (IQR) measures the spread of the middle 50% of a data set, specifically the range between the lower quartile (Q1) and the upper quartile (Q3). It is useful for understanding the spread of data without being influenced by extreme values or outliers.
How does the interquartile range differ from the range of a data set?
-While the range gives the spread of the entire data set by subtracting the smallest value from the largest, the interquartile range focuses only on the middle 50% of the data, which makes it less sensitive to extreme values and outliers.
What is the first step in finding the interquartile range?
-The first step is to order the data set from least to greatest. This ensures that we can accurately calculate the median and quartiles.
How do you find the median of a data set?
-To find the median, you locate the middle value of the ordered data set. If there’s an odd number of data points, the median is the middle number. For an even number of data points, the median is the average of the two middle numbers.
What does Q2 represent in the context of quartiles?
-Q2 represents the median of the data set, which is also known as the 50th percentile. It divides the data into two equal halves.
How do you find the lower quartile (Q1)?
-To find Q1, you focus on the lower half of the data set (excluding the median if the data set has an odd number of values). The median of this lower half is the lower quartile.
How do you find the upper quartile (Q3)?
-To find Q3, you look at the upper half of the data set (again excluding the median for odd-numbered data sets). The median of this upper half is the upper quartile.
What is the significance of the interquartile range?
-The interquartile range is significant because it provides a measure of spread that focuses on the central portion of the data, offering a clearer picture of variability by ignoring the effects of extreme outliers.
In the first example, how was the median of the data set found?
-In the first example, the median was found by identifying the middle number in the ordered data set. Since there were seven data points, the middle value was 38.
How do you calculate the interquartile range once you have the quartiles?
-To calculate the interquartile range, you subtract the lower quartile (Q1) from the upper quartile (Q3). For example, if Q3 is 50 and Q1 is 32, the interquartile range is 50 - 32 = 18.
Outlines

This section is available to paid users only. Please upgrade to access this part.
Upgrade NowMindmap

This section is available to paid users only. Please upgrade to access this part.
Upgrade NowKeywords

This section is available to paid users only. Please upgrade to access this part.
Upgrade NowHighlights

This section is available to paid users only. Please upgrade to access this part.
Upgrade NowTranscripts

This section is available to paid users only. Please upgrade to access this part.
Upgrade NowBrowse More Related Video

Perbedaan Jangkauan, Jangkauan Interkuartil dan Kuartil pada Statistika

STATISTIKA - Cara mudah menentukan nilai Jangkauan, Jangkauan antarkuartil dan Simpangan kuartil
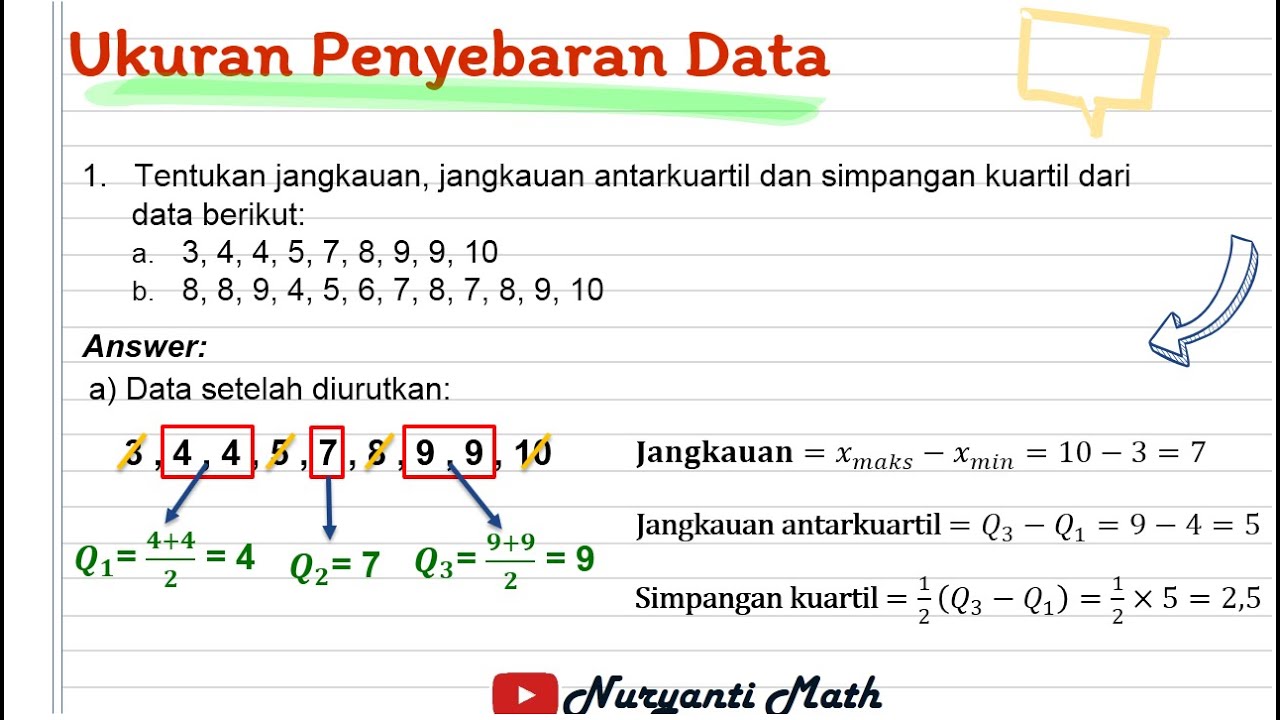
Ukuran Penyebaran Data (Jangkauan, Jangkauan Antarkuartil, Simpangan Kuartil) - STATISTIKA Kelas 8

STATISTIKA Part 2- Jangkauan, Kuartil dan Jangkauan interkuartil
Statistika Kelas 8 [Part 4] - Menentukan Jangkauan, Kuartil, dan Jangkauan Interkuartil

Statistics - Module 3 Video 3 - Variance and Coefficient of Variation - Problem 3-2Bab
5.0 / 5 (0 votes)