Statistika Kelas 8 [Part 4] - Menentukan Jangkauan, Kuartil, dan Jangkauan Interkuartil
Summary
TLDRIn this educational video, Pak Beni explains key statistical concepts, focusing on the calculation of range, quartiles, and interquartile range (IQR). He breaks down each concept with clear definitions and step-by-step examples, starting with how to find the range by subtracting the smallest data point from the largest. He then moves on to quartiles, explaining how to divide data into four equal parts, and demonstrates how to calculate the first, second (median), and third quartiles. Lastly, Pak Beni explores the concept of interquartile range as the difference between Q3 and Q1, providing examples to reinforce the learning.
Takeaways
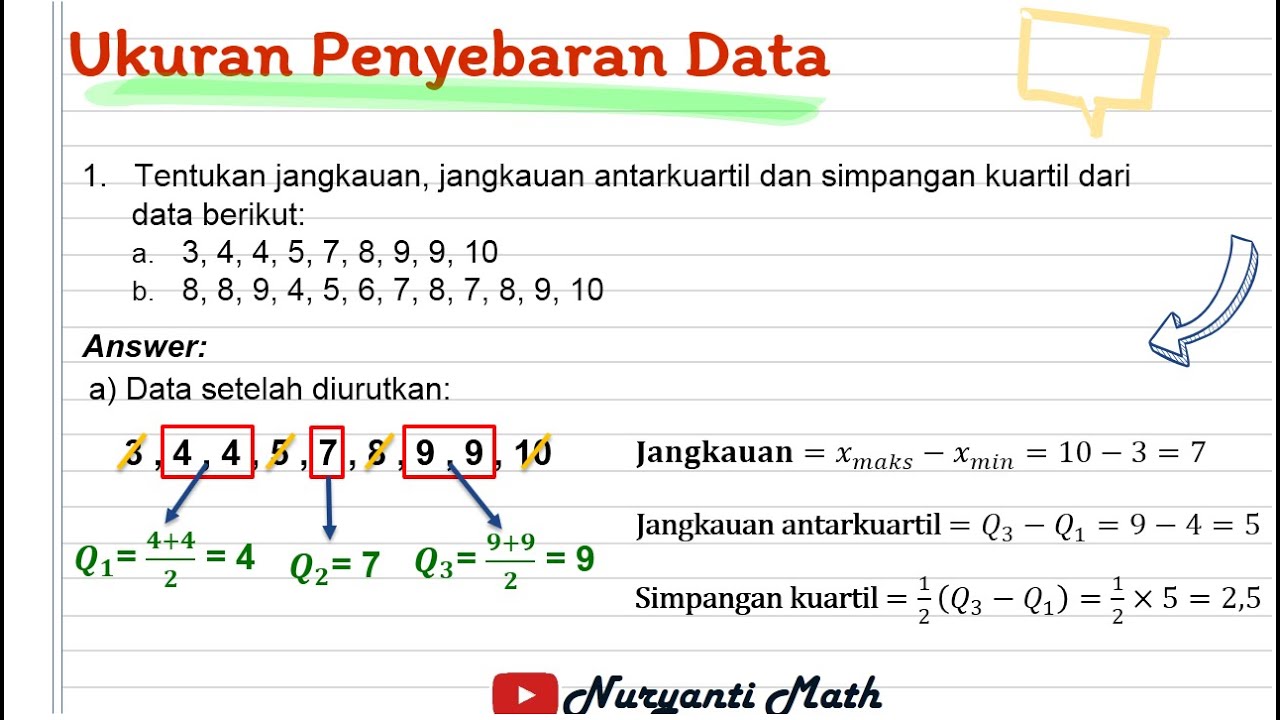
- 😀 The range of a data set is the difference between the largest and smallest values.
- 😀 Quartiles divide a data set into four equal parts after it has been ordered.
- 😀 The first quartile (Q1) is the median of the lower half of the data.
- 😀 The second quartile (Q2) is the median of the entire data set.
- 😀 The third quartile (Q3) is the median of the upper half of the data.
- 😀 The interquartile range (IQR) is calculated by subtracting Q1 from Q3.
- 😀 The range formula is: Range = Largest value - Smallest value.
- 😀 To calculate quartiles, sort the data, then find Q1, Q2, and Q3 based on the median positions.
- 😀 When calculating the median of an even number of data points, average the two middle numbers.
- 😀 The IQR focuses on the middle 50% of the data, providing insight into data spread without outliers.
- 😀 In the example provided, the IQR was calculated to be 2 by subtracting Q1 from Q3, which helped highlight the central data distribution.
Q & A
What is the primary purpose of watching this video?
-The purpose of watching this video is to understand the concept of range, quartiles, and interquartile range of a data set.
What is the definition of range in a data set?
-The range is the difference between the largest and the smallest data values in a set.
How do you calculate the range of a data set?
-To calculate the range, subtract the smallest data value from the largest data value.
What is a quartile?
-A quartile is a value that divides a data set into four equal parts after sorting the data.
How many quartiles are there, and what are they called?
-There are three quartiles: Q1 (lower quartile), Q2 (median), and Q3 (upper quartile).
What is the relationship between the median and Q2?
-The median of a data set is also known as Q2, as it divides the data into two equal halves.
How do you find the value of Q2 (median)?
-To find Q2, identify the middle value in the data set. If the number of data points is odd, it is the central value. If even, the median is the average of the two middle values.
How is Q1 (lower quartile) determined?
-Q1 is the median of the lower half of the data set, which lies between the smallest value and Q2.
How is Q3 (upper quartile) determined?
-Q3 is the median of the upper half of the data set, which lies between Q2 and the largest value.
What is the interquartile range, and how is it calculated?
-The interquartile range (IQR) is the difference between Q3 and Q1, representing the range of the middle 50% of the data.
Outlines

This section is available to paid users only. Please upgrade to access this part.
Upgrade NowMindmap

This section is available to paid users only. Please upgrade to access this part.
Upgrade NowKeywords

This section is available to paid users only. Please upgrade to access this part.
Upgrade NowHighlights

This section is available to paid users only. Please upgrade to access this part.
Upgrade NowTranscripts

This section is available to paid users only. Please upgrade to access this part.
Upgrade NowBrowse More Related Video

STATISTIKA Part 2- Jangkauan, Kuartil dan Jangkauan interkuartil

Perbedaan Jangkauan, Jangkauan Interkuartil dan Kuartil pada Statistika
Ukuran Penyebaran Data (Jangkauan, Jangkauan Antarkuartil, Simpangan Kuartil) - STATISTIKA Kelas 8

Statistika 2 ~ Ukuran Penyebaran Data (Jangkauan, Kuartil, Hamparan) ~ Materi PJJ Kelas VIII / 8 SMP

Ukuran Penyebaran Data | Statistika Kelas 8

STATISTIKA - Cara mudah menentukan nilai Jangkauan, Jangkauan antarkuartil dan Simpangan kuartil
5.0 / 5 (0 votes)