What is Data Wrangling? | Data Wrangling with Python | Data Wrangling | Intellipaat
Summary
TLDRThis video tutorial focuses on data wrangling using pandas in Python, demonstrating how to create and manipulate data frames. It covers essential operations such as filtering data, generating summary statistics, and creating pivot tables to analyze price data across different suburbs and sellers. The instructor illustrates the use of functions like groupby and pivot_table, emphasizing the importance of data aggregation methods such as mean and sum. The session also promotes a data engineering course in collaboration with MIT, aimed at helping participants enhance their skills and secure employment.
Takeaways
- 😀 Data wrangling is essential for transforming raw data into a usable format, enabling businesses to leverage vast amounts of data effectively.
- 📊 Key steps in data wrangling include discovery, structuring, cleaning, transformation, enriching, binning, aggregating, validating, and publishing.
- 🛠️ Proficiency in tools like Python, SQL, and Excel is crucial for roles in data analysis and business intelligence.
- 📚 Python libraries such as NumPy, Pandas, and Matplotlib are fundamental for data manipulation, statistical analysis, and visualization.
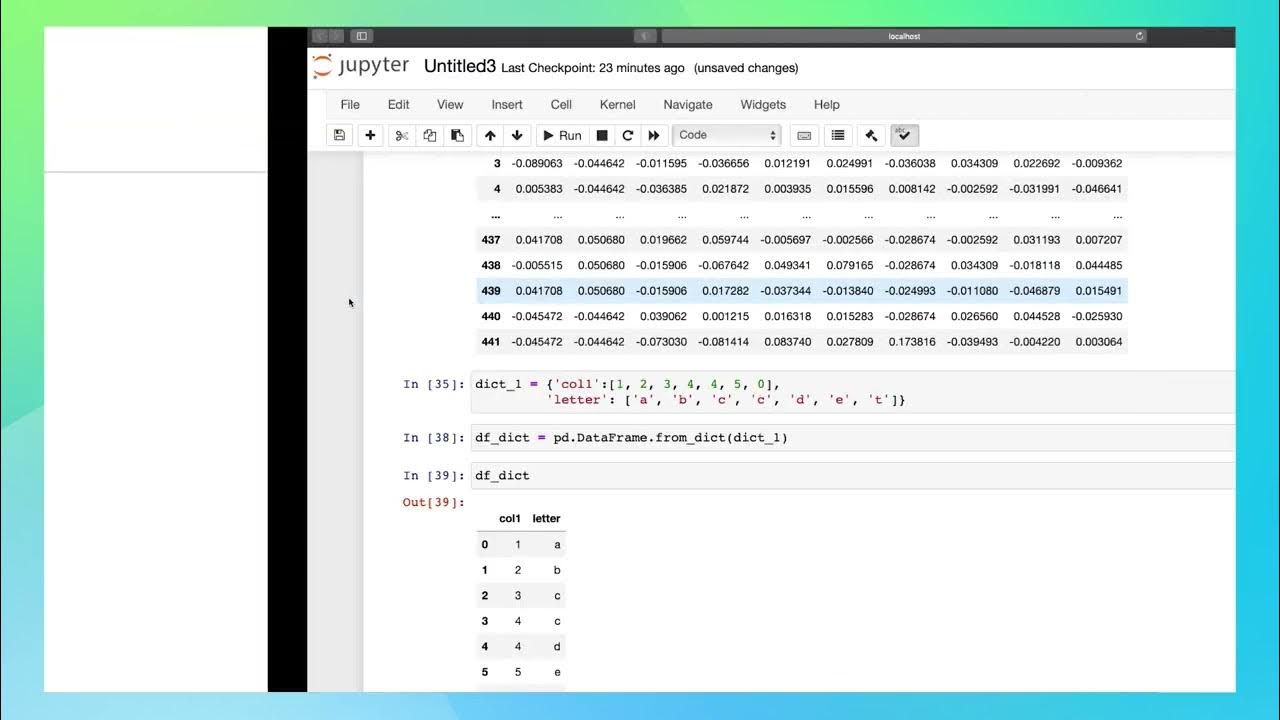
- 💻 Hands-on sessions provide practical experience, showcasing how to filter data, manage missing values, and generate descriptive statistics.
- 📅 Date range filtering helps in selecting relevant subsets of data for analysis, enhancing the relevance of insights derived.
- 🔄 Pivot tables are powerful tools for summarizing data, allowing analysts to view relationships between different variables at a glance.
- 🔍 Understanding and handling missing values is critical in data preparation to ensure accurate analysis outcomes.
- 🌐 Advanced data visualization libraries like Plotly and Seaborn enhance the presentation of data insights, making them more interactive.
- 🎓 Continuous learning and upskilling, such as through courses offered by Intellipaat in collaboration with MIT, can help individuals achieve their career goals in data engineering.
Q & A
What is the main purpose of data wrangling?
-The main purpose of data wrangling is to convert raw data into a usable format for analysis, which involves cleaning, structuring, and enriching the data.
What are the key steps involved in the data wrangling process?
-The key steps in data wrangling include discovery, structuring, cleaning, transforming, enriching, binning, aggregating, validating, and publishing the data.
Why is data cleaning considered an essential part of data wrangling?
-Data cleaning is essential because it addresses errors and inconsistencies in the data, such as missing values and outliers, ensuring the quality and reliability of the analysis.
Which Python libraries are commonly used for data wrangling?
-Commonly used Python libraries for data wrangling include NumPy, Pandas, Scikit-learn, Matplotlib, SciPy, Seaborn, and Plotly.
What function can be used in Pandas to summarize dataset metrics?
-The `describe()` function in Pandas can be used to summarize the main metrics of a dataset, including count, mean, min, and max values.
How can missing values be addressed in a dataset?
-Missing values can be addressed using methods such as `dropna()` to remove them or `fillna()` to replace them with a specified value.
What is the purpose of creating a pivot table in data analysis?
-A pivot table is used to summarize and aggregate data, allowing users to view relationships between different dimensions, such as suburbs and sellers, in a more organized format.
What does the 'np.sum' function do in the context of creating a pivot table?
-The 'np.sum' function is used as an aggregation method to calculate the total prices associated with each combination of index and columns in the pivot table.
Can you provide an example of a scenario where data wrangling is necessary?
-Data wrangling is necessary when dealing with large datasets from various sources, such as customer data that may contain duplicates, missing information, or inconsistent formats that need to be cleaned and standardized for analysis.
What are the benefits of using Intellipaat's data engineering course mentioned in the video?
-The benefits of the Intellipaat data engineering course include a job guarantee program, collaboration with MIT for advanced education, and instruction from industry experts, which can enhance career prospects.
Outlines

Cette section est réservée aux utilisateurs payants. Améliorez votre compte pour accéder à cette section.
Améliorer maintenantMindmap

Cette section est réservée aux utilisateurs payants. Améliorez votre compte pour accéder à cette section.
Améliorer maintenantKeywords

Cette section est réservée aux utilisateurs payants. Améliorez votre compte pour accéder à cette section.
Améliorer maintenantHighlights

Cette section est réservée aux utilisateurs payants. Améliorez votre compte pour accéder à cette section.
Améliorer maintenantTranscripts

Cette section est réservée aux utilisateurs payants. Améliorez votre compte pour accéder à cette section.
Améliorer maintenantVoir Plus de Vidéos Connexes
5.0 / 5 (0 votes)


