Tableau Bar Chart Tutorial for Beginners | Learning Tableau | sqlbelle
Summary
TLDRThis video tutorial walks viewers through the creation of basic bar charts in Tableau, including horizontal, vertical, and stacked bar charts. The presenter explains the significance of rows versus columns and the use of green and blue pills, representing continuous and discrete fields respectively. The demonstration covers creating charts by organizing data on shelves, sorting charts, and enhancing visualizations using colors and groupings. Viewers are provided with practical insights to refine and customize their bar charts for better data presentation.
Takeaways
- 📊 Today's session focuses on how to create basic bar charts in Tableau, including horizontal, vertical, and stacked bar charts.
- 🔄 A quick review explains that rows display data vertically, while columns display data horizontally in Tableau.
- 🟢 Green pills in Tableau represent continuous fields, creating axes and producing number lines.
- 🔵 Blue pills represent discrete fields, which produce headers and slice up data into categories.
- 📉 A horizontal bar chart is created when the bars lay flat along the x-axis, with green pills on the column shelf and blue pills on the row shelf.
- 📂 To create a horizontal bar chart, the dataset used is from a data breaches dataset, where 'number of records stolen' is placed on the column shelf.
- 🔁 A vertical bar chart can be created by switching the placement of the green and blue pills—green on rows and blue on columns.
- 🔄 You can easily swap between horizontal and vertical bar charts using Tableau's shortcut to switch rows and columns.
- 🎨 Stacked bar charts are created by subdividing bars using properties like color, size, or labels, further segmenting data fields.
- 🔧 For stacked bar charts, discrete fields like year can be used to color-segment the bars, with the option to group similar values for clarity.
Q & A
What is the primary topic covered in this video?
-The video explains how to create basic bar charts in Tableau, including horizontal, vertical, and stacked bar charts.
What is the key difference between rows and columns in Tableau when building charts?
-When a data point is placed in rows, it gets displayed vertically, and when a data point is placed in columns, it is displayed horizontally.
What are 'green pills' in Tableau, and what do they represent?
-Green pills in Tableau represent continuous fields, and they produce axes or number lines.
What do 'blue pills' in Tableau represent, and how do they impact the chart?
-Blue pills represent discrete fields in Tableau, and they produce headers that slice up the data.
How can you create a horizontal bar chart in Tableau?
-To create a horizontal bar chart, place a continuous field (green pill) on the columns shelf and a discrete field (blue pill) on the rows shelf.
How can you adjust the bar chart to fit the entire screen in Tableau?
-You can change the fit from 'Standard' to 'Entire View' to display the chart on the full screen.
What is the purpose of sorting the bar chart in Tableau?
-Sorting the bar chart makes it easier to identify which data points have the highest or lowest values.
How can you create a vertical bar chart in Tableau?
-To create a vertical bar chart, place the continuous field (green pill) on the rows shelf and the discrete field (blue pill) on the columns shelf.
How can you quickly switch between horizontal and vertical bar charts in Tableau?
-You can use the shortcut in Tableau to swap the rows and columns, instantly switching between horizontal and vertical bar charts.
How can you create a stacked bar chart in Tableau?
-To create a stacked bar chart, start with either a horizontal or vertical bar chart, and then use the Marks card to subdivide the bar by adding a discrete field to properties like 'Color'.
Outlines

Cette section est réservée aux utilisateurs payants. Améliorez votre compte pour accéder à cette section.
Améliorer maintenantMindmap

Cette section est réservée aux utilisateurs payants. Améliorez votre compte pour accéder à cette section.
Améliorer maintenantKeywords

Cette section est réservée aux utilisateurs payants. Améliorez votre compte pour accéder à cette section.
Améliorer maintenantHighlights

Cette section est réservée aux utilisateurs payants. Améliorez votre compte pour accéder à cette section.
Améliorer maintenantTranscripts

Cette section est réservée aux utilisateurs payants. Améliorez votre compte pour accéder à cette section.
Améliorer maintenantVoir Plus de Vidéos Connexes

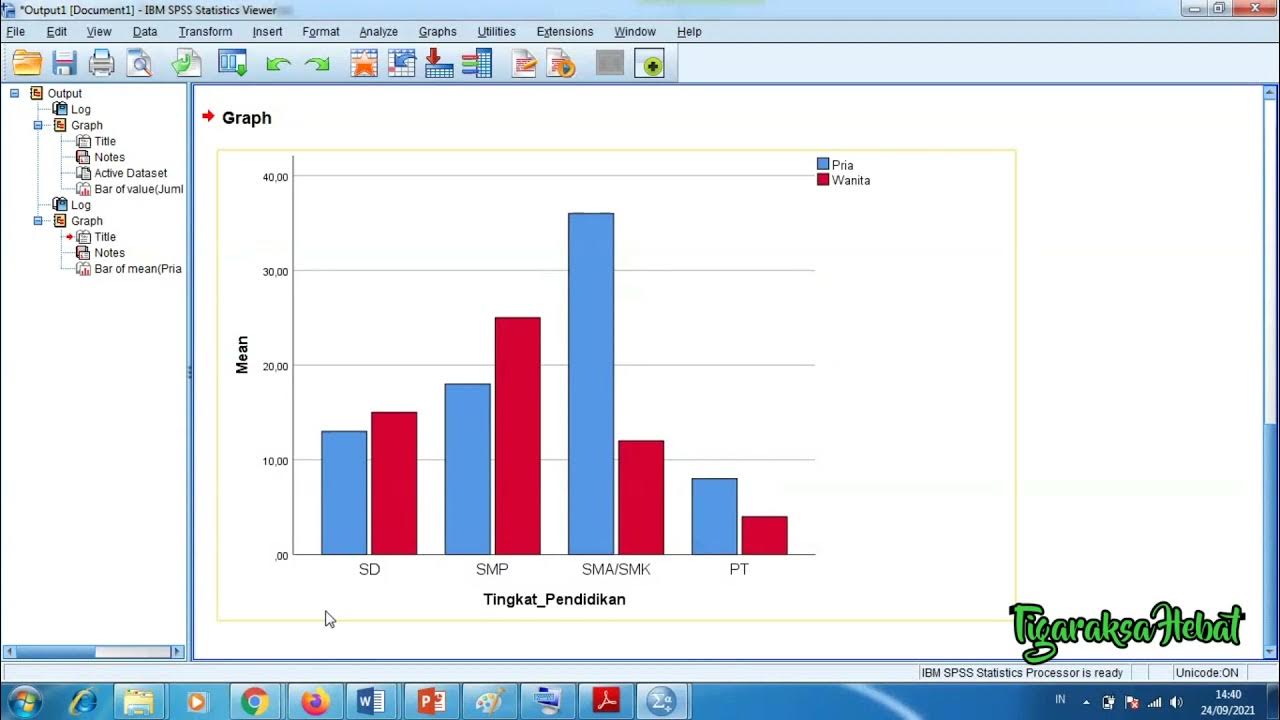
Penyajian Data Statistik Menggunakan SPSS

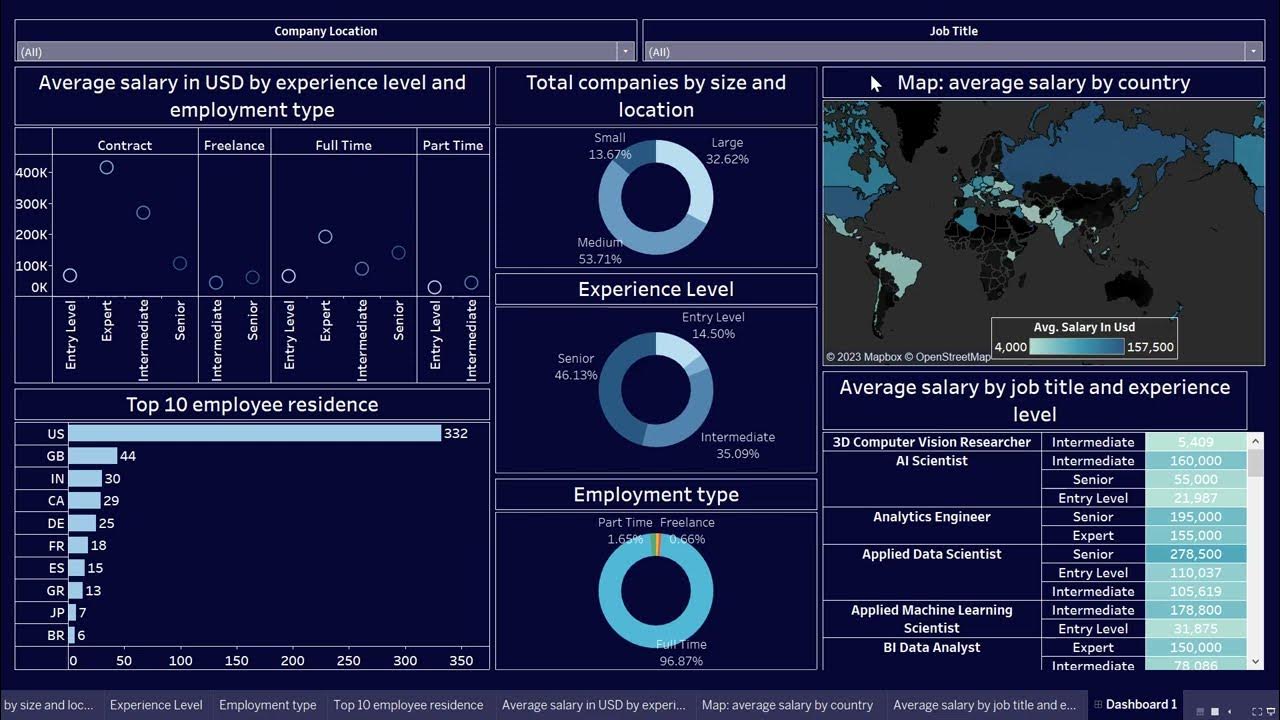
Create Data Science Jobs salaries dashboard with Tableau in 25 minutes

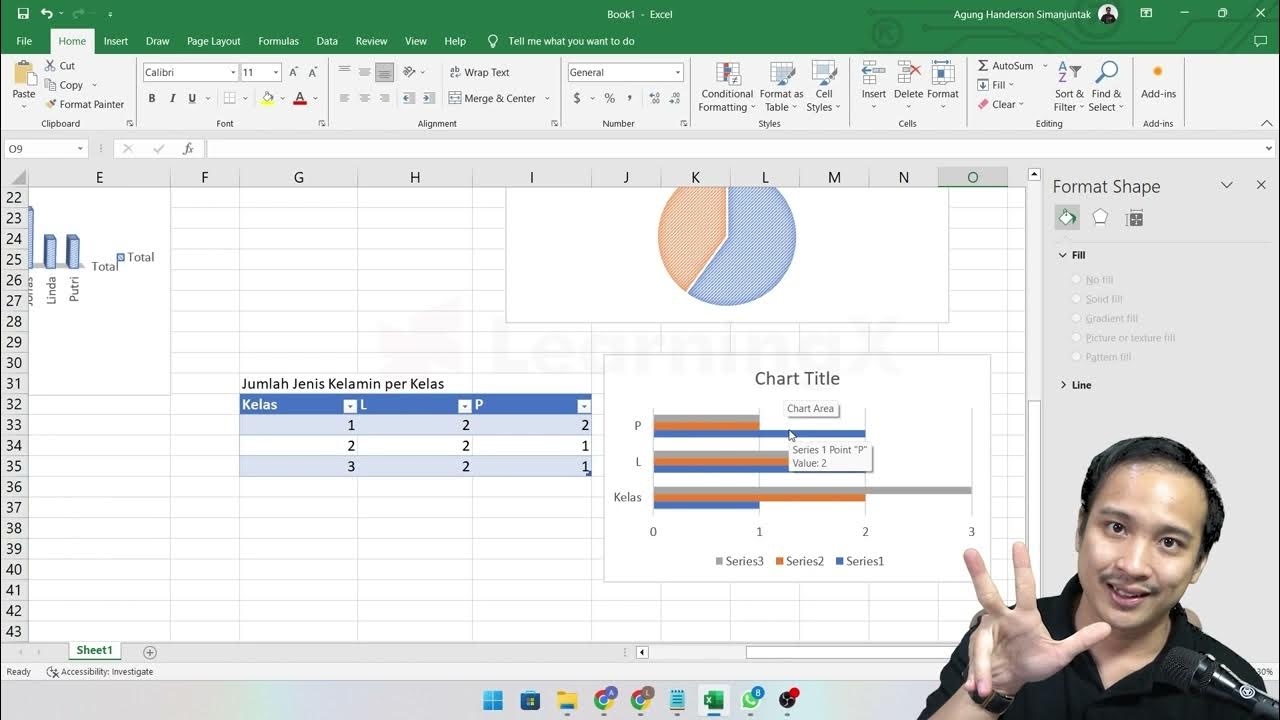
Chapter 5 - Analisa Data melalui Excel | Informatika Booster

Customer Analysis using Tableau - Dashboard From Scratch

Statistik : Penyajian Data - Part 1

STATISTIKA | PENYAJIAN DATA TUNGGAL [Tabel, Diagram Garis, Diagram Batang, Lingkaran]
5.0 / 5 (0 votes)
