Statistics Grade 10: Quartiles

Kevinmathscience
20 Aug 202104:29

Summary

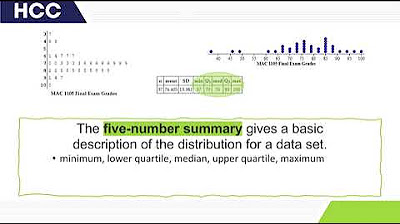
TLDRThis lesson focuses on the concepts of lower and upper quartiles, median, and range in data analysis. The instructor demonstrates how to arrange data in ascending order and calculate the lower quartile (Q1) as the median of the lower half of the data set, resulting in 4.5. The upper quartile (Q3) is similarly found as the median of the upper half, yielding 9. The range is defined as the difference between the highest and lowest data values, which is 9 in this case. The interquartile range (IQR) is the difference between Q3 and Q1, calculated to be 4.5. The video also introduces a mathematical method to determine quartile positions using the formula (n+1)/4 for Q1 and 3*((n+1)/4) for Q3, where n is the number of data points.

Takeaways

  • 📝 Always arrange data values from smallest to largest before calculating quartiles.
  • 🔢 The lower quartile (Q1) is the median of the lower half of the data.
  • 📌 To find the median, cross off an equal number of values from both ends until the middle value is reached.
  • 🧩 For an odd number of data points, the median is the middle value after sorting.
  • 📊 The upper quartile (Q3) is the median of the upper half of the data.
  • 📘 The range of a data set is the difference between the highest and lowest values.
  • 📈 A more mathematical approach to find quartiles involves using the formula (n + 1) / 4 for Q1 and 3 * (n + 1) / 4 for Q3, where n is the number of data points.
  • 🔍 When the result of the quartile formula is not a whole number, interpolate between the two closest data points.
  • 📐 The interquartile range (IQR) is calculated by subtracting Q1 from Q3.
  • 📝 The IQR is a measure of statistical dispersion and is equal to the range of the middle 50% of the data.
  • 📚 Understanding quartiles and the IQR helps in analyzing the distribution of data and identifying potential outliers.

Q & A

  • What is the purpose of arranging data from smallest to biggest?

    -Arranging data from smallest to biggest is important for identifying statistical measures such as the median, quartiles, and range, which require the data to be in a specific order.

  • What is the definition of the lower quartile (Q1)?

    -The lower quartile, or Q1, is the median of the lower half of the data set, representing the middle value of the lower 50% of the data.

  • How do you find the median of a data set?

    -To find the median, arrange the data in ascending order and identify the middle number. If there is an even number of data points, the median is the average of the two middle numbers.

  • What is the formula for calculating the position of the lower quartile (Q1)?

    -The position of Q1 can be calculated using the formula (n + 1) / 4, where n is the total number of data points.

  • How do you find the value of Q1 when there are two numbers at the calculated position?

    -When there are two numbers at the calculated position for Q1, you take the average of these two numbers to find the value of Q1.

  • What is the definition of the upper quartile (Q3)?

    -The upper quartile, or Q3, is the median of the upper half of the data set, representing the middle value of the upper 50% of the data.

  • How do you calculate the position of the upper quartile (Q3)?

    -The position of Q3 is calculated using the formula 3 * ((n + 1) / 4), where n is the total number of data points.

  • What is the range of a data set?

    -The range of a data set is the difference between the highest and lowest values, indicating the spread of the data.

  • What is the interquartile range (IQR) and how is it calculated?

    -The interquartile range (IQR) is the range of the middle 50% of the data, calculated by subtracting Q1 from Q3 (IQR = Q3 - Q1).

  • Why is the interquartile range (IQR) a useful statistical measure?

    -The IQR is useful because it gives an idea of the spread of the middle 50% of the data, which can be helpful in identifying outliers and understanding data distribution.

  • What does it mean if the IQR is large?

    -A large IQR indicates that the middle 50% of the data is spread out over a wide range, suggesting possible outliers or a non-normal distribution.

Outlines

00:00

📊 Introduction to Quartiles and Range

This paragraph introduces the statistical concepts of lower and upper quartiles, as well as range. The speaker begins by emphasizing the importance of arranging data from smallest to largest. The lower quartile, or Q1, is explained as the median of the lower half of the data set. The process of finding the median is demonstrated, which involves finding the middle number after arranging the data. The upper quartile, or Q3, is similarly the median of the upper half of the data. The range is defined as the difference between the highest and lowest values in the data set. Additionally, a mathematical approach to finding quartiles is introduced, using the formula (n+1)/4 for Q1 and 3*(n+1)/4 for Q3, where n is the number of data points.

Mindmap

Keywords

💡Quartile

A quartile is a statistical measure that divides a dataset into quarters, each containing an equal number of observations. In the video, quartiles are used to understand the distribution of data. The lower quartile (Q1) and upper quartile (Q3) are specifically mentioned, which help in identifying the middle 50% of the data. The script explains how to calculate these quartiles by dividing the dataset into halves and then further into quarters.

💡Lower Quartile

The lower quartile, denoted as Q1, represents the median of the lower half of the data. It is a measure that helps in understanding the lower 25% of the dataset. In the script, the process of finding Q1 involves ignoring the median and then finding the median of the remaining lower half of the data, which in the example is calculated as 4.5.

💡Upper Quartile

The upper quartile, denoted as Q3, is the median of the upper half of the data. It represents the middle 25% of the dataset. The script demonstrates how to calculate Q3 by finding the median of the upper half of the data after the median has been removed, resulting in a value of 9 in the example provided.

💡Median

The median is the middle value of a dataset when the numbers are arranged in ascending order. It is a measure of central tendency that divides the data into two equal halves. In the script, the median is initially found to divide the data into two halves, which is a crucial step in determining the quartiles.

💡Range

The range is a measure of dispersion that is calculated by subtracting the smallest value in a dataset from the largest value. It provides an idea of the spread of the data. In the script, the range is calculated by subtracting the lowest value (3) from the highest value (12), resulting in a range of 9.

💡Interquartile Range (IQR)

The interquartile range is the difference between the upper quartile (Q3) and the lower quartile (Q1). It measures the spread of the middle 50% of the data. In the script, the IQR is calculated as 9 - 4.5, which helps in understanding the variability within the central portion of the dataset.

💡Data Arrangement

Data arrangement refers to the process of sorting the values in a dataset from smallest to largest. This is a fundamental step in many statistical analyses, including the calculation of quartiles and the median. The script emphasizes the importance of arranging data before proceeding with quartile calculations.

💡Position Calculation

Position calculation in the context of quartiles involves determining the index or position in the dataset where the quartile value should be found. The script explains that to find Q1 and Q3, you calculate (n+1)/4 and 3*(n+1)/4 respectively, where n is the number of data points.

💡Statistical Analysis

Statistical analysis is the process of examining data to draw conclusions about the population from which the data is collected. In the script, statistical analysis is demonstrated through the calculation of quartiles, median, range, and IQR, which are all tools used to understand the distribution and dispersion of data.

💡Dispersion

Dispersion refers to the spread of data points in a dataset. It is an important aspect of data analysis as it helps in understanding the variability within the data. The script discusses dispersion through the calculation of the range and the interquartile range, which are measures of dispersion.

💡Central Tendency

Central tendency is a measure that describes the center point of a dataset. It is typically represented by the mean, median, or mode. In the script, the median is used as a measure of central tendency to help in the calculation of quartiles, which further helps in understanding the central portion of the data.

Highlights

Lesson focuses on calculating lower quartile, upper quartile, and range of a dataset.

Always arrange data values from smallest to biggest before calculating quartiles.

Lower quartile (Q1) is the median of the lower half of the data.

Median is the middle value of the dataset.

Upper quartile (Q3) is the median of the upper half of the data.

Calculate Q1 by averaging the middle two numbers in the lower half.

Q1 is 4.5 for the given dataset.

Calculate Q3 by averaging the middle two numbers in the upper half.

Q3 is 9 for the given dataset.

Data is divided into quarters to find quartiles.

Range is calculated as the difference between the highest and lowest values.

Range for the given dataset is 9.

There is a mathematical formula to find quartiles.

Use (n+1)/4 to find the position of the lower quartile.

Position 2.5 means go to the value between the 4th and 5th data points.

Use 3 * (n+1)/4 to find the position of the upper quartile.

Position 7.5 means go to the value between the 7th and 8th data points.

Interquartile range (IQR) is the difference between Q3 and Q1.

IQR for the given dataset is 4.5.

Transcripts

play00:00

welcome to another lesson in this lesson

play00:02

we're going to look at the lower

play00:03

quartile upper quartile and range

play00:07

lower quartile

play00:08

is the lower quarter of the data but

play00:12

first remember what's the most important

play00:14

thing always arrange the values from

play00:16

smallest to biggest so i'm going to do

play00:18

that quickly

play00:20

like that

play00:21

now the lower quartile it's

play00:25

it's the middle

play00:26

of the lowest middle okay so

play00:29

let's quickly explain what i mean by

play00:30

that so let's find the middle number

play00:32

what do we call that do you remember

play00:33

from the previous lesson well that's

play00:35

called the median so let's find the

play00:36

median first so we can

play00:39

cross off that cross that one off cross

play00:41

that one off that one that one that one

play00:43

that one that one and

play00:45

there's the middle so now that we have

play00:46

the middle let's ignore that one now we

play00:49

can look at this lower half and we'll

play00:51

call that the upper half now what number

play00:53

is halfway or what number is the middle

play00:55

number in this half well if we cross

play00:58

there across there oh now we stuck with

play01:01

two numbers all you do is you add those

play01:03

two numbers together and then you divide

play01:05

by two so that's going to give us four

play01:08

and a half so we can say that q1 which

play01:10

stands for the lower quarter

play01:13

or lower quartile

play01:16

is 4.5

play01:18

if we look at the upper quarter well

play01:20

that's we crossed that one across that

play01:22

one and then we stuck with 7 and 11. so

play01:24

what we do is we add them together so we

play01:26

say 7 plus 11 and we divide the answer

play01:28

by 2 and that's going to give us

play01:30

9 so q3 which we can also call the upper

play01:34

quartile is equal to 9. so we've just

play01:37

divided our data into

play01:40

quarters so this number here or over

play01:43

there divides it into two halves and

play01:46

then this number over here divides the

play01:49

lower half into a half and then this

play01:51

number over here which is between the 7

play01:53

and 11 divides the data into or divides

play01:56

the upper half in half as well so what

play01:59

we have is we've just cut the data there

play02:01

we've cut the data there and we've cut

play02:03

the data there so we've got three

play02:05

quarters 1

play02:07

two

play02:08

three

play02:09

four okay so that's where we get the

play02:11

word quarter from then the next thing i

play02:13

want to talk about is the range now

play02:16

range

play02:17

is your highest value minus your lowest

play02:20

value so your highest value is 12 and

play02:21

your lowest value is three

play02:23

so the range

play02:25

is going to be 12 minus three which is

play02:28

nine

play02:29

something else i want to talk about is

play02:31

is there a more mathematical way to do

play02:33

lower quarter and upper quarter yes

play02:36

there is so when we looked at the

play02:37

previous lesson we said that to find the

play02:39

median which is the one in the halfway

play02:41

position we could say n plus one divided

play02:44

by two

play02:46

so to find quarters we say n plus 1

play02:49

divided by

play02:50

4 and n is the number of values that you

play02:53

have which in this case is 9 so we say 9

play02:55

plus 1 divided by 4 which is going to

play02:57

give us 2.5 that is not the answer that

play03:01

is the position that you should go to so

play03:04

you go to position number one position

play03:06

number two and then position two and a

play03:08

half is going to be exactly in between

play03:10

the four and the five and that's how we

play03:12

got

play03:12

4.5 okay kevin now how do we find the

play03:15

third quarter well you still say n plus

play03:18

one over four but you take whatever that

play03:20

answer is and you multiply it by three

play03:23

because we're looking for the third

play03:24

quarter so that's going to be three

play03:26

times we said that this part becomes 2.5

play03:30

and three times two point five is seven

play03:32

point five that is not the answer you

play03:34

must go to position seven point five so

play03:36

we go to position number one two three

play03:39

four five six seven

play03:42

the 11 would be eight so seven and a

play03:44

half is exactly in between seven and

play03:46

eleven so you add the seven and eleven

play03:48

together and you divide them by two and

play03:51

that is how we got the value of

play03:54

nine so we can say that the answer there

play03:55

is nine so the upper quarter is nine the

play03:58

lower quarter is four and a half the

play04:00

middle value is six

play04:02

and then the range the range is nine

play04:05

then the last thing they might want to

play04:07

ask you to work out the

play04:08

inter quartile

play04:11

range

play04:13

your teacher might call it the iqr

play04:16

that's easy it's the range of the

play04:18

quartile values so it's q3

play04:21

minus q1 so that's going to be 9 minus

play04:25

4.5 which is equal to

play04:27

4.5

Rate This

5.0 / 5 (0 votes)

Etiquetas Relacionadas
QuartilesMedianRangeStatisticsEducationData AnalysisMathematicsQuartile CalculationInterquartile RangeStatistical Methods
¿Necesitas un resumen en inglés?