Fungsi Kuadrat Bagian 2 - Grafik Fungsi Kuadrat Matematika Wajib Kelas X m4thlab
Summary
TLDRThis video provides an in-depth explanation of quadratic functions, focusing on graphing techniques. The presenter, Deni Handayani, covers essential steps such as determining x and y-intercepts, finding the vertex (or turning point), and sketching the curve. The video also explains the effects of the coefficients a, b, and c on the graph's shape and direction, with practical examples. Viewers learn how to predict the graph's behavior based on these coefficients and how to identify key points for sketching accurate quadratic graphs. The video is perfect for students seeking to understand the fundamentals of quadratic functions.
Takeaways
- 😀 To sketch a quadratic function graph, start by finding the x-intercepts and y-intercept by substituting 0 for y and x respectively.
- 😀 The vertex or turning point of a quadratic function can be calculated using the formula x = -b/2a, and substituting it back into the function to find y.
- 😀 Additional points between the x-intercepts can be calculated as auxiliary points to refine the smoothness of the graph, though this is optional.
- 😀 Once points are determined, connect them smoothly to form the parabola representing the quadratic function.
- 😀 The coefficient 'a' determines whether the parabola opens upward (a > 0) or downward (a < 0).
- 😀 The coefficient 'b' influences the direction the parabola leans: positive b leans right, negative b leans left, and zero b is symmetric around the vertex.
- 😀 The constant 'c' affects the y-intercept of the quadratic function; positive c means the graph crosses above the x-axis, negative c below, and zero at the origin.
- 😀 By analyzing the parabola's opening and lean, one can predict the signs of a, b, and c without full calculation.
- 😀 Using graphical analysis, you can select the appropriate quadratic equation from multiple-choice options based on the vertex, intercepts, and lean.
- 😀 The discriminant (Δ = b² - 4ac) determines whether the quadratic graph intersects the x-axis: positive for two points, zero for tangent, and negative for no intersection.
Q & A
What is the main topic of the video?
-The video discusses quadratic functions, specifically focusing on how to sketch their graphs and the effects of different coefficients (a, b, c) on the graph's shape and position.
What are the first steps in sketching the graph of a quadratic function?
-The first step is to find the x- and y-intercepts. For the x-intercepts, set y (f(x)) to 0 and solve for x. For the y-intercept, set x to 0 and solve for f(x).
How do you find the vertex of a quadratic function?
-The vertex, or turning point, is found using the formula for the x-coordinate: x = -b/(2a). Once you have the x-coordinate, substitute it back into the function to find the y-coordinate.
What is the role of the discriminant in the graph of a quadratic function?
-The discriminant (D = b² - 4ac) determines the nature of the roots of the quadratic equation. If D > 0, the graph intersects the x-axis at two points. If D = 0, it touches the x-axis at one point (the vertex). If D < 0, the graph does not intersect the x-axis.
What is the effect of the coefficient 'a' on the graph of a quadratic function?
-The coefficient 'a' determines the direction in which the parabola opens. If 'a' is positive, the parabola opens upwards; if 'a' is negative, the parabola opens downwards.
How does the coefficient 'b' affect the graph of a quadratic function?
-The coefficient 'b' affects the direction in which the graph is tilted. If 'b' is positive, the graph is skewed to the right, and if 'b' is negative, the graph is skewed to the left.
What does the constant 'c' represent in a quadratic function?
-The constant 'c' represents the y-intercept of the quadratic function. It indicates where the graph intersects the y-axis.
How do you identify the signs of the coefficients 'a', 'b', and 'c' from a graph?
-To identify 'a', check the direction of the parabola: if it opens upwards, 'a' is positive; if downwards, 'a' is negative. To identify 'b', observe the tilt of the graph: if it leans right, 'b' is positive; if left, 'b' is negative. To identify 'c', see where the graph intersects the y-axis; if above the axis, 'c' is positive, if below, 'c' is negative.
What is the significance of the vertex in a quadratic function's graph?
-The vertex is the highest or lowest point on the graph, depending on whether the parabola opens upwards or downwards. It represents the maximum or minimum value of the quadratic function.
How does one decide whether the value of 'b' is positive, negative, or zero based on the graph?
-By observing the graph's skew: if the parabola opens more to the right, 'b' is positive; if it leans more to the left, 'b' is negative; and if the parabola is symmetrical, 'b' is zero.
Outlines

هذا القسم متوفر فقط للمشتركين. يرجى الترقية للوصول إلى هذه الميزة.
قم بالترقية الآنMindmap

هذا القسم متوفر فقط للمشتركين. يرجى الترقية للوصول إلى هذه الميزة.
قم بالترقية الآنKeywords

هذا القسم متوفر فقط للمشتركين. يرجى الترقية للوصول إلى هذه الميزة.
قم بالترقية الآنHighlights

هذا القسم متوفر فقط للمشتركين. يرجى الترقية للوصول إلى هذه الميزة.
قم بالترقية الآنTranscripts

هذا القسم متوفر فقط للمشتركين. يرجى الترقية للوصول إلى هذه الميزة.
قم بالترقية الآنتصفح المزيد من مقاطع الفيديو ذات الصلة
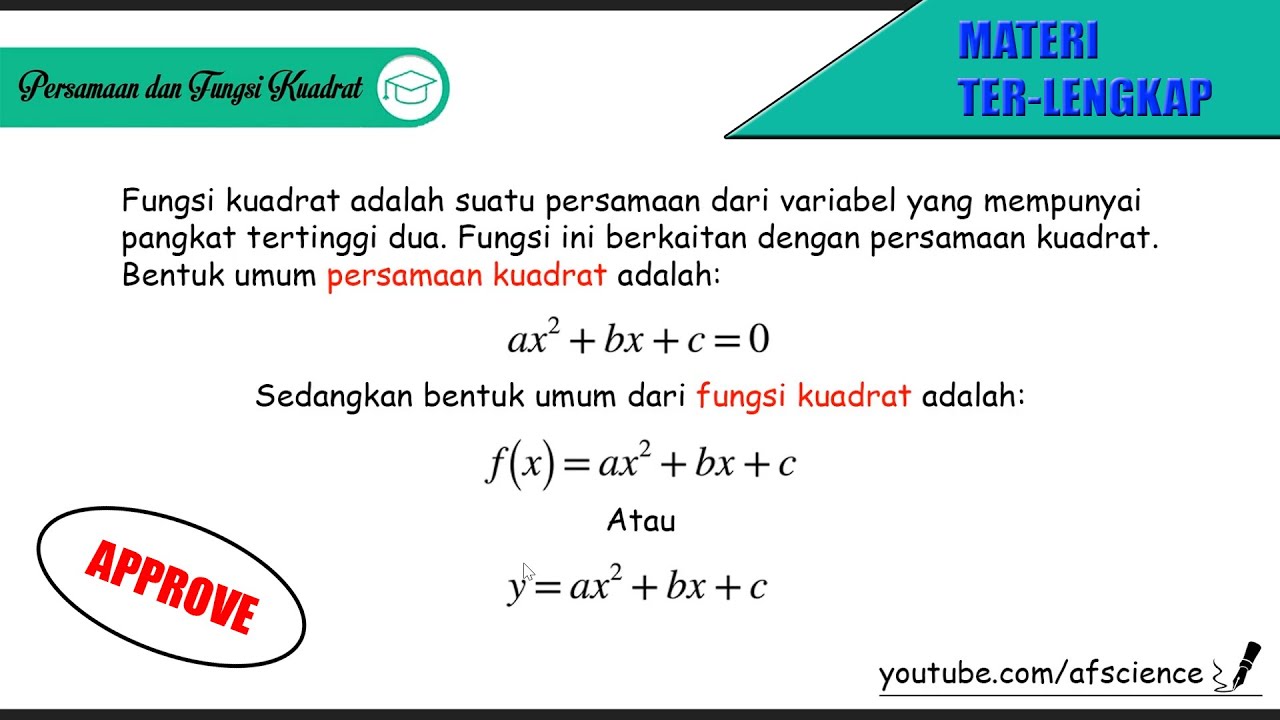
Persamaan dan Fungsi Kuadrat (Materi LENGKAP)

Mudah Banget! Cara Menggambar dan Membaca Grafik Fungsi Kuadrat
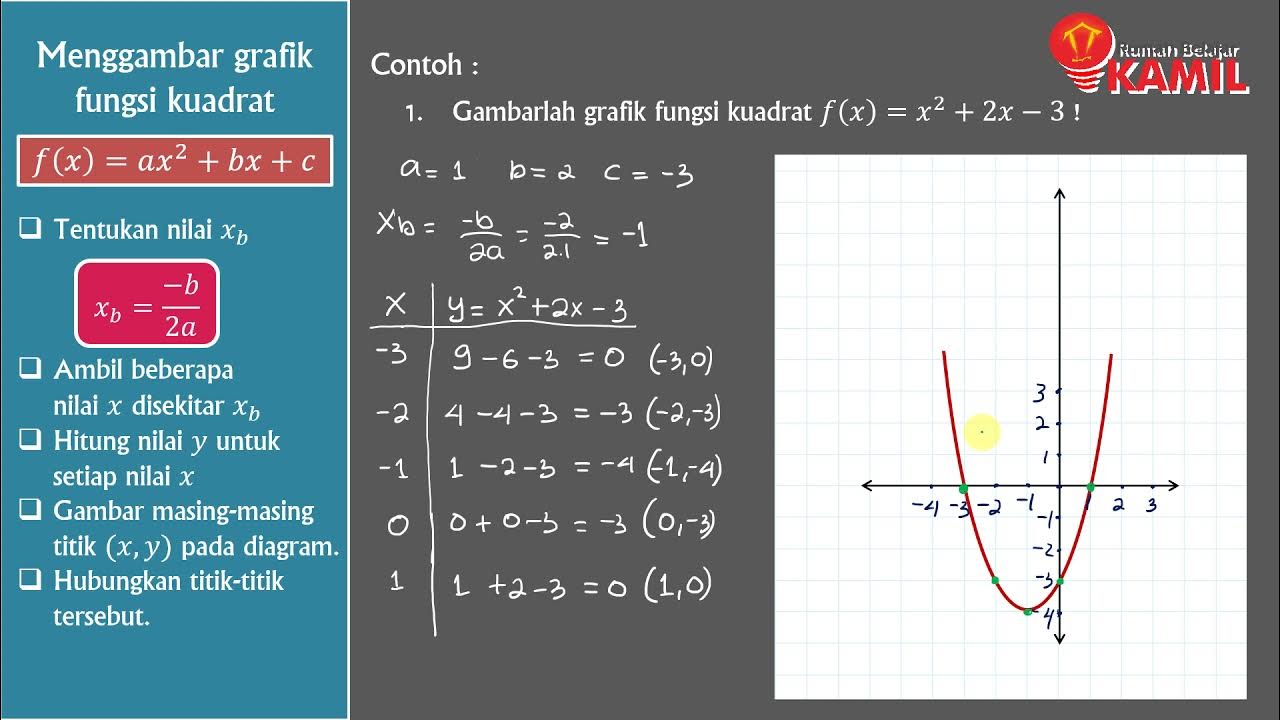
Matematika Kelas 9 : Fungsi Kuadrat (Part 3 : Menggambar grafik fungsi kuadrat)
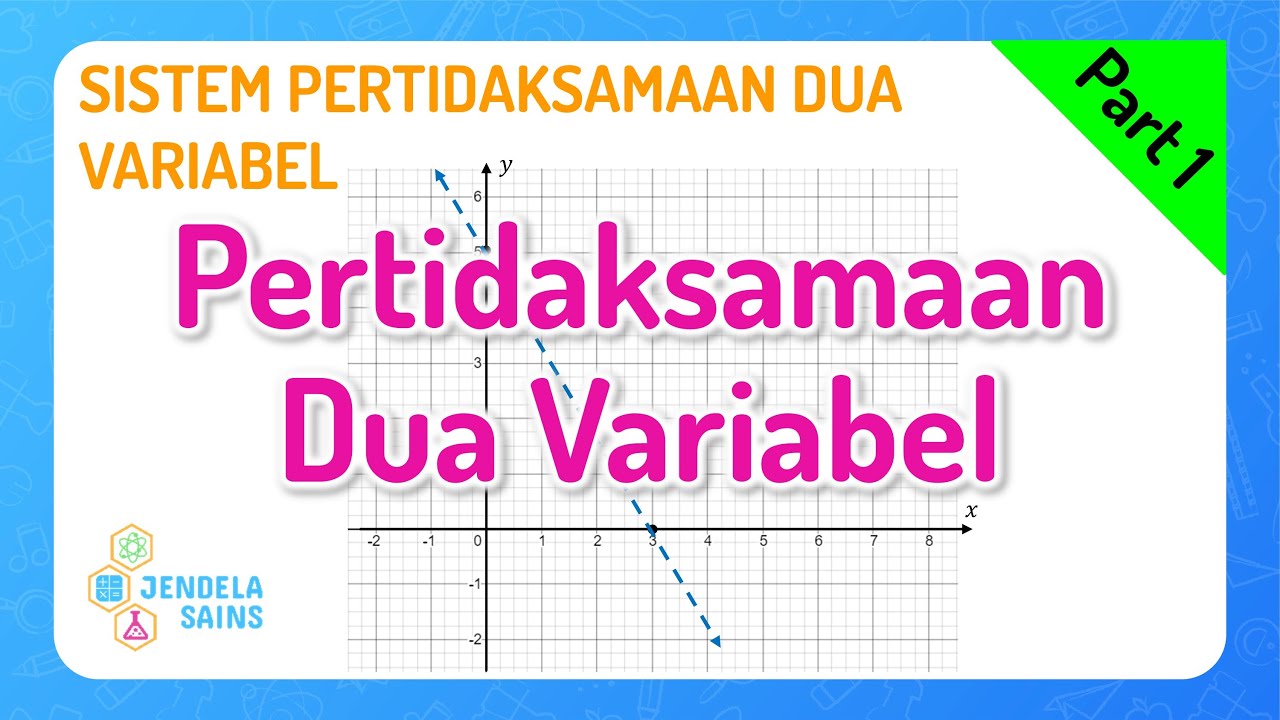
SPtDV Matematika Kelas 10 • Part 1: Pertidaksamaan Linear & Kuadrat Dua Variabel
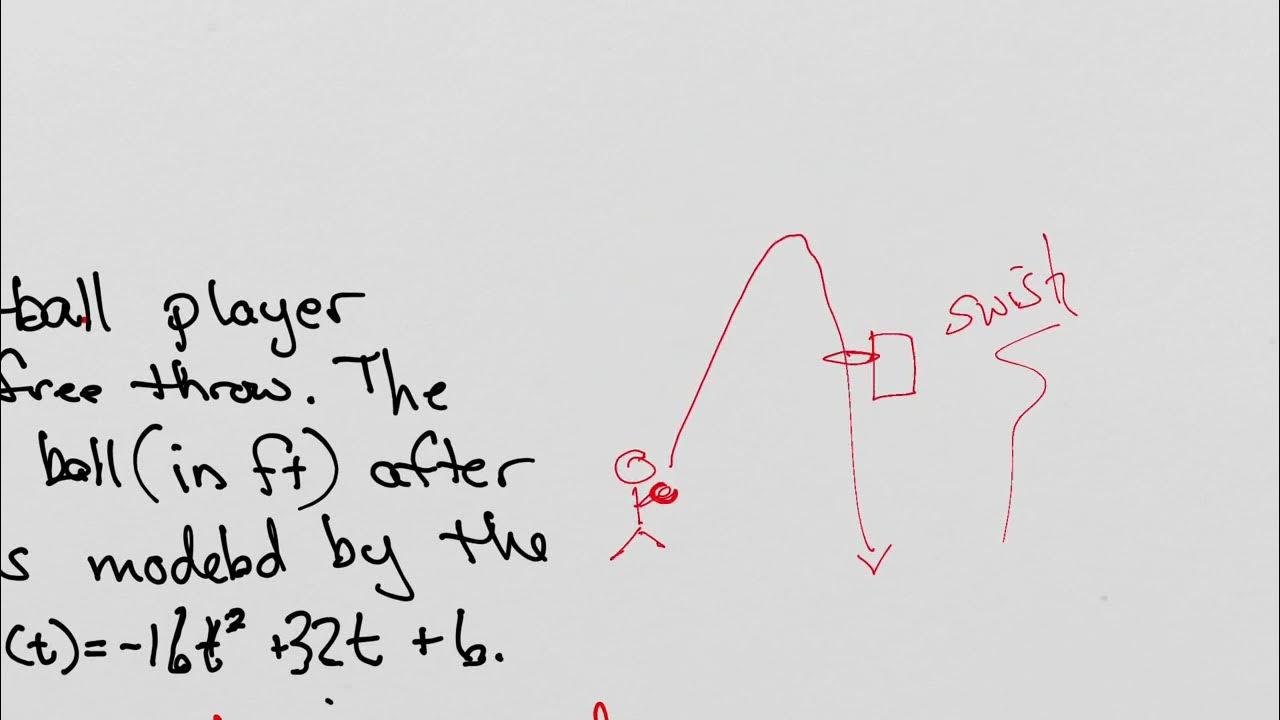
Graphing quadratic inequalities unit 2 day something
MaTek 1 Menggambar grafik Fungsi Linier #Part 6#Matematika Teknik 1
5.0 / 5 (0 votes)
