Mudah Banget! Cara Menggambar dan Membaca Grafik Fungsi Kuadrat
Summary
TLDRThis educational video provides an in-depth guide on graphing and analyzing quadratic functions. It covers key concepts like finding the intersections with the x-axis and y-axis, identifying the vertex (extremum points), and understanding the symmetry of the parabola. Viewers learn how to interpret the discriminant to determine the number of real roots, as well as how to graph the function accurately by substituting values and connecting points. The video is a valuable resource for mastering the basics of quadratic functions, from drawing the graph to analyzing its properties based on the coefficients.
Takeaways
- 😀 Understanding quadratic functions is key to analyzing their graphs, including identifying points of intersection with the axes and analyzing the shape of the graph.
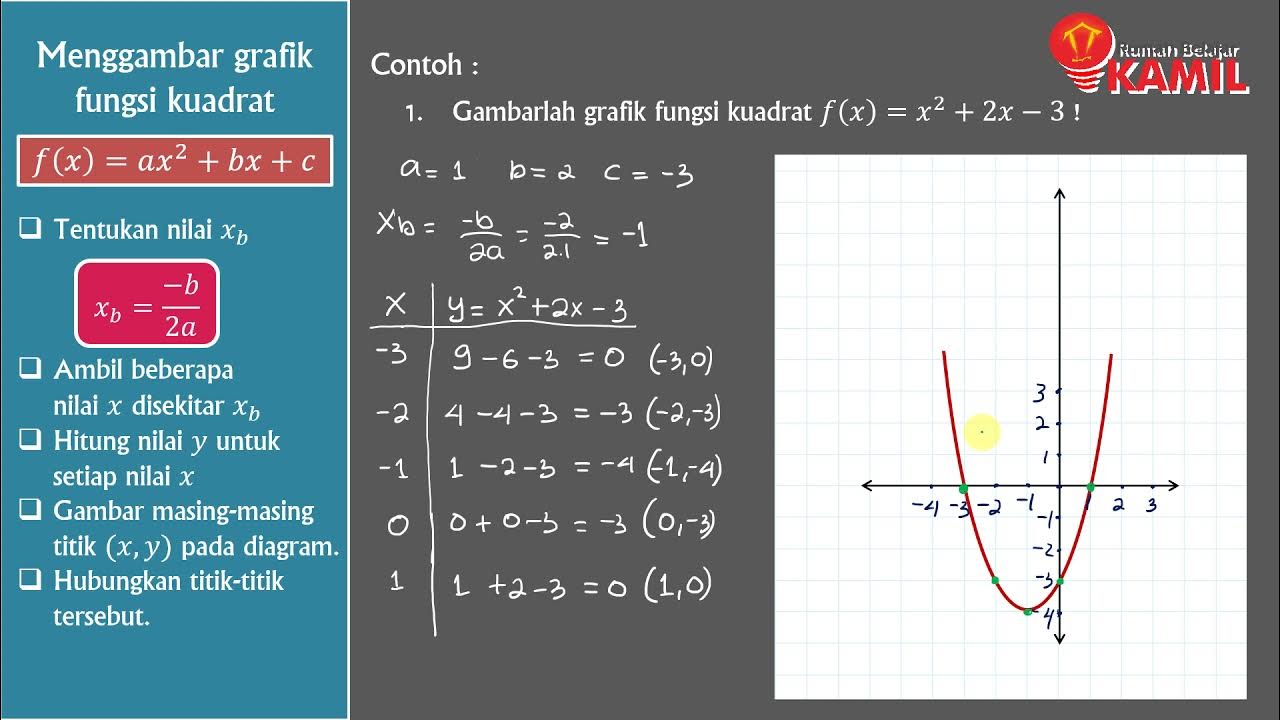
- 😀 To graph a quadratic function, start by finding the points where the curve intersects the x-axis and y-axis.
- 😀 The x-axis intersection points (the roots) are found by setting y = 0 and solving the quadratic equation.
- 😀 The y-axis intersection is determined by substituting x = 0 into the quadratic function.
- 😀 The vertex or extreme point of the parabola is crucial for understanding the function’s minimum or maximum value.
- 😀 The axis of symmetry passes through the vertex and is calculated using the formula x = -b/2a, which helps in finding the x-coordinate of the vertex.
- 😀 The minimum or maximum value of the quadratic function can be calculated by substituting the x-coordinate of the vertex into the original function.
- 😀 To ensure the graph is accurate, additional points on the curve can be calculated by substituting random x-values into the function.
- 😀 After identifying multiple points on the graph, connect them smoothly to form the quadratic curve.
- 😀 The discriminant (Δ) of a quadratic function reveals important properties: if Δ > 0, the function intersects the x-axis at two points; if Δ = 0, it touches at one point; and if Δ < 0, it does not intersect the x-axis at all.
- 😀 The orientation of the parabola (upward or downward) depends on the coefficient 'a' in the quadratic function. If 'a' is positive, the parabola opens upwards, and if 'a' is negative, it opens downwards.
Q & A
What are the three main topics covered in the lesson about quadratic functions?
-The lesson covers three main topics: 1) How to graph a quadratic function, 2) How to read the graph of a quadratic function, and 3) How to analyze the graph based on the values of 'a' and the discriminant (D).
What is the first step in graphing a quadratic function?
-The first step in graphing a quadratic function is to find the points where the graph intersects the x-axis (the x-intercepts). This is done by setting y = 0 and solving the quadratic equation.
How do you find the y-intercept of a quadratic function?
-To find the y-intercept, set x = 0 and substitute it into the quadratic function. The resulting value will give you the point where the graph intersects the y-axis.
What is the significance of the vertex in a quadratic graph?
-The vertex of a quadratic function is the point where the curve reaches its minimum or maximum value, depending on the orientation of the parabola. It is also located on the axis of symmetry of the graph.
What is the axis of symmetry of a quadratic function?
-The axis of symmetry is a vertical line that divides the parabola into two symmetrical parts. The equation of the axis of symmetry can be found using the formula x = -b/2a, where 'a' and 'b' are the coefficients from the quadratic equation.
How can the discriminant of a quadratic equation be used to analyze the graph?
-The discriminant (D) of a quadratic equation helps determine the nature of the roots of the equation. If D > 0, the graph intersects the x-axis at two points; if D = 0, the graph touches the x-axis at one point; and if D < 0, the graph does not intersect the x-axis.
What does it mean when a quadratic function's graph opens upwards or downwards?
-A quadratic function's graph opens upwards if the coefficient 'a' is positive, indicating a minimum point at the vertex. If 'a' is negative, the graph opens downwards, indicating a maximum point at the vertex.
How do you calculate the minimum or maximum value of a quadratic function?
-The minimum or maximum value of a quadratic function can be found by substituting the x-coordinate of the vertex (found using x = -b/2a) into the quadratic equation to get the corresponding y-coordinate.
How do you graph a quadratic function with given x-intercepts and a known point on the curve?
-To graph a quadratic function with known x-intercepts and a point on the curve, use the factored form of the quadratic equation y = a(x - x1)(x - x2), where x1 and x2 are the x-intercepts. Substitute the known point into this equation to solve for 'a'.
What is the process for determining the quadratic function from three known points on the graph?
-To determine the quadratic function from three known points, substitute the x and y coordinates of each point into the general form y = ax^2 + bx + c to create a system of three equations. Solve this system to find the values of a, b, and c.
Outlines

This section is available to paid users only. Please upgrade to access this part.
Upgrade NowMindmap

This section is available to paid users only. Please upgrade to access this part.
Upgrade NowKeywords

This section is available to paid users only. Please upgrade to access this part.
Upgrade NowHighlights

This section is available to paid users only. Please upgrade to access this part.
Upgrade NowTranscripts

This section is available to paid users only. Please upgrade to access this part.
Upgrade NowBrowse More Related Video
Graphing quadratic inequalities unit 2 day something

Fungsi Kuadrat Bagian 2 - Grafik Fungsi Kuadrat Matematika Wajib Kelas X m4thlab

MATERI UTBK SNBT MATEMATIKA SAINTEK PERTIDAKSAMAAN KUADRAT
Matematika Kelas 9 : Fungsi Kuadrat (Part 1 : Bentuk umum dan grafik fungsi kuadrat)
Matematika Kelas 9 : Fungsi Kuadrat (Part 3 : Menggambar grafik fungsi kuadrat)

Menggambar fungsi piecewise, linear dan kuadrat, by Top Mat
5.0 / 5 (0 votes)