Matematika Kelas 9 : Fungsi Kuadrat (Part 3 : Menggambar grafik fungsi kuadrat)
Summary
TLDRThis video tutorial guides 9th-grade students through the process of graphing quadratic functions. It covers the general form of a quadratic equation, the concept of the vertex as the turning point, and the key formula for finding the vertex’s coordinates. The video demonstrates two examples of quadratic equations, illustrating how to calculate the vertex and plot points on a Cartesian plane. The process of drawing the parabola is explained step by step, emphasizing the importance of symmetry and plotting multiple points for accuracy. Overall, it provides a clear, practical approach to graphing quadratic functions.
Please replace the link and try again.
Q & A
What is the general form of a quadratic function?
-The general form of a quadratic function is FX = AX² + BX + C, where A is the coefficient of X², B is the coefficient of X, and C is the constant term.
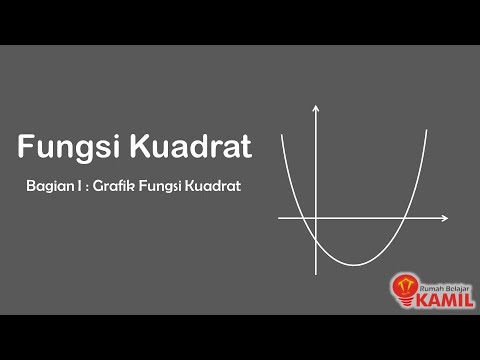
What does the graph of a quadratic function look like?
-The graph of a quadratic function is a parabola. It can either open upwards or downwards depending on the sign of the coefficient A.
What is the vertex of a parabola in the context of quadratic functions?
-The vertex of a parabola is the point where the graph changes direction. It can either be the lowest point if the parabola opens upwards or the highest point if it opens downwards. The coordinates of the vertex are represented by (XB, YB).
How do you calculate the value of XB (the x-coordinate of the vertex)?
-To calculate XB, use the formula XB = -B / 2A, where B is the coefficient of X, and A is the coefficient of X².
What is the significance of the value YB (the y-coordinate of the vertex)?
-The value YB is the function value at XB and represents the minimum or maximum value of the quadratic function. It is calculated by substituting XB into the original quadratic function.
What is the concept of symmetry in the graph of a quadratic function?
-The graph of a quadratic function is symmetric with respect to the vertical line passing through the vertex, called the axis of symmetry. This axis has the equation X = XB.
In the example with the function FX = X² + 2X - 3, how do you calculate XB?
-In the function FX = X² + 2X - 3, A = 1, B = 2, and C = -3. Using the formula XB = -B / 2A, we calculate XB = -2 / (2 × 1) = -1.
How do you find the corresponding Y values for various X values in a quadratic function?
-To find the corresponding Y values for specific X values, substitute each X value into the quadratic function and solve for Y. For example, for X = -3, X² + 2X - 3 gives Y = 0.
What is the process for graphing a quadratic function step by step?
-First, calculate XB using the formula. Then, calculate YB by substituting XB into the function. Afterward, choose several X values around XB, calculate the corresponding Y values, and plot these points on a graph. Finally, connect the points to form the parabola.
In the second example with the function FX = -2X² + 4X + 6, how is XB calculated?
-In the function FX = -2X² + 4X + 6, A = -2, B = 4, and C = 6. Using the formula XB = -B / 2A, we calculate XB = -4 / (2 × -2) = 1.
Outlines

This section is available to paid users only. Please upgrade to access this part.
Upgrade NowMindmap

This section is available to paid users only. Please upgrade to access this part.
Upgrade NowKeywords

This section is available to paid users only. Please upgrade to access this part.
Upgrade NowHighlights

This section is available to paid users only. Please upgrade to access this part.
Upgrade NowTranscripts

This section is available to paid users only. Please upgrade to access this part.
Upgrade NowBrowse More Related Video
Matematika Kelas 9 : Fungsi Kuadrat (Part 1 : Bentuk umum dan grafik fungsi kuadrat)
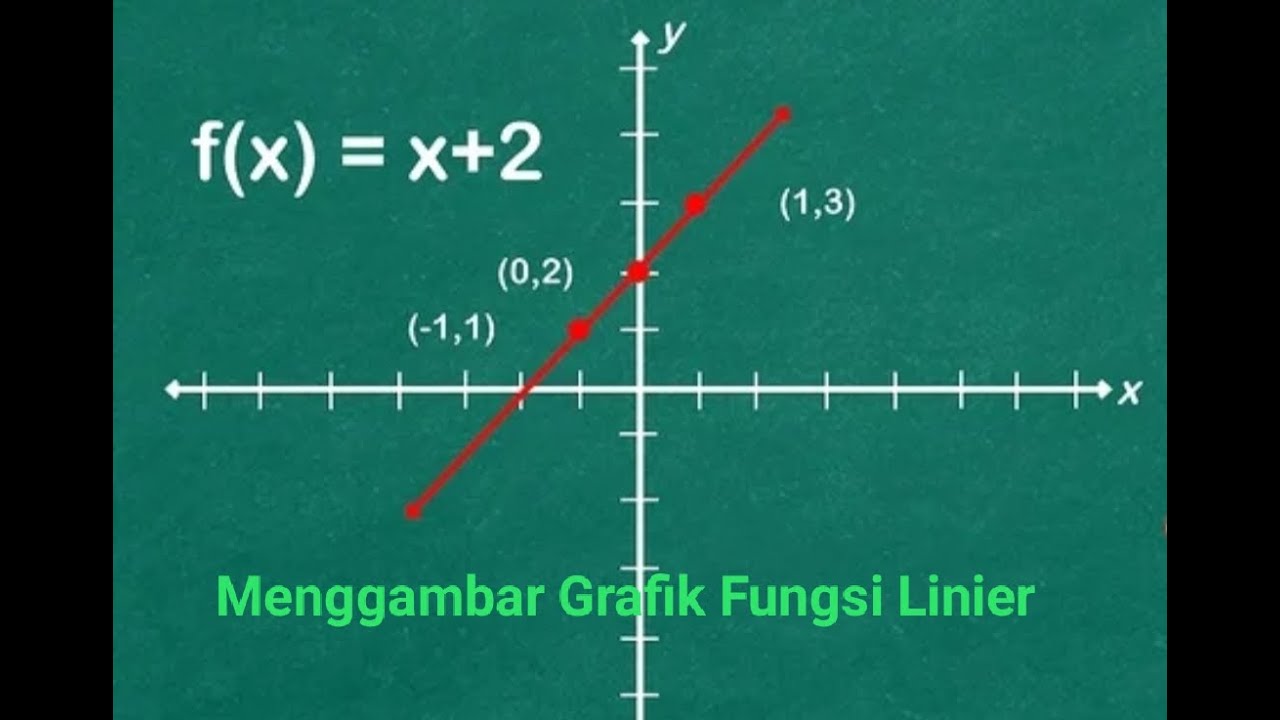
MaTek 1 Menggambar grafik Fungsi Linier #Part 6#Matematika Teknik 1
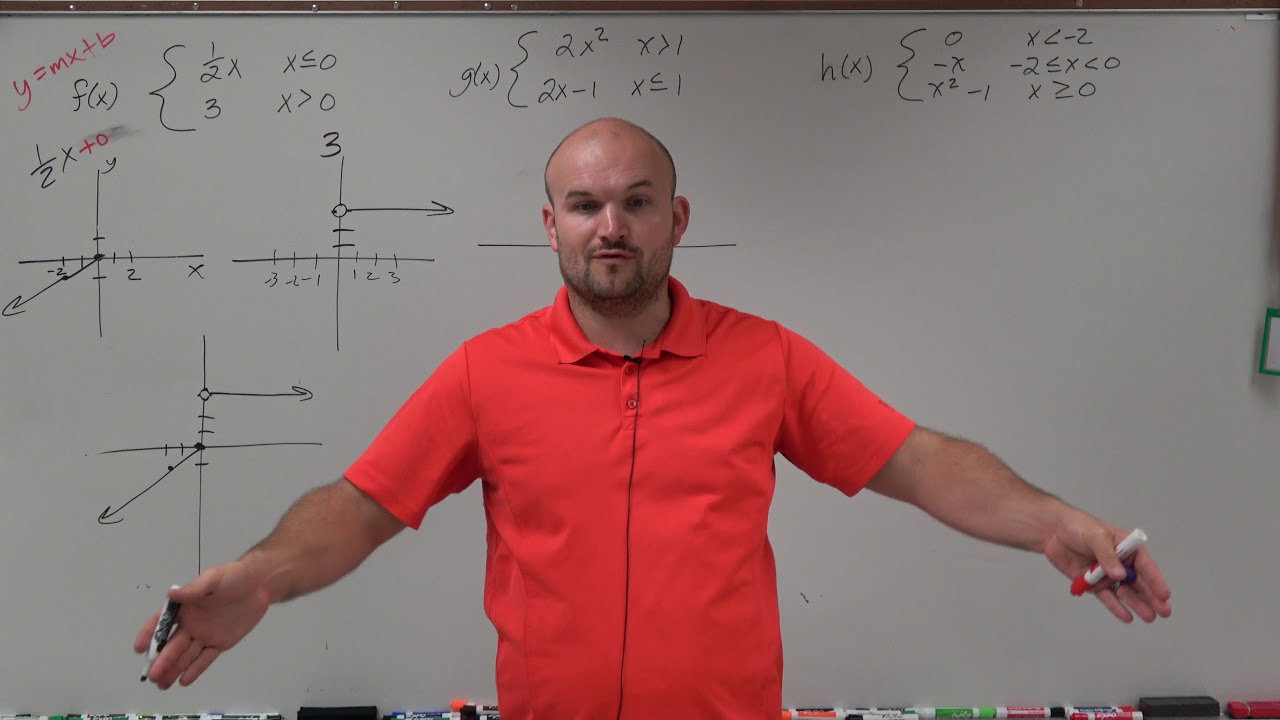
Master Graphing Piecewise Functions
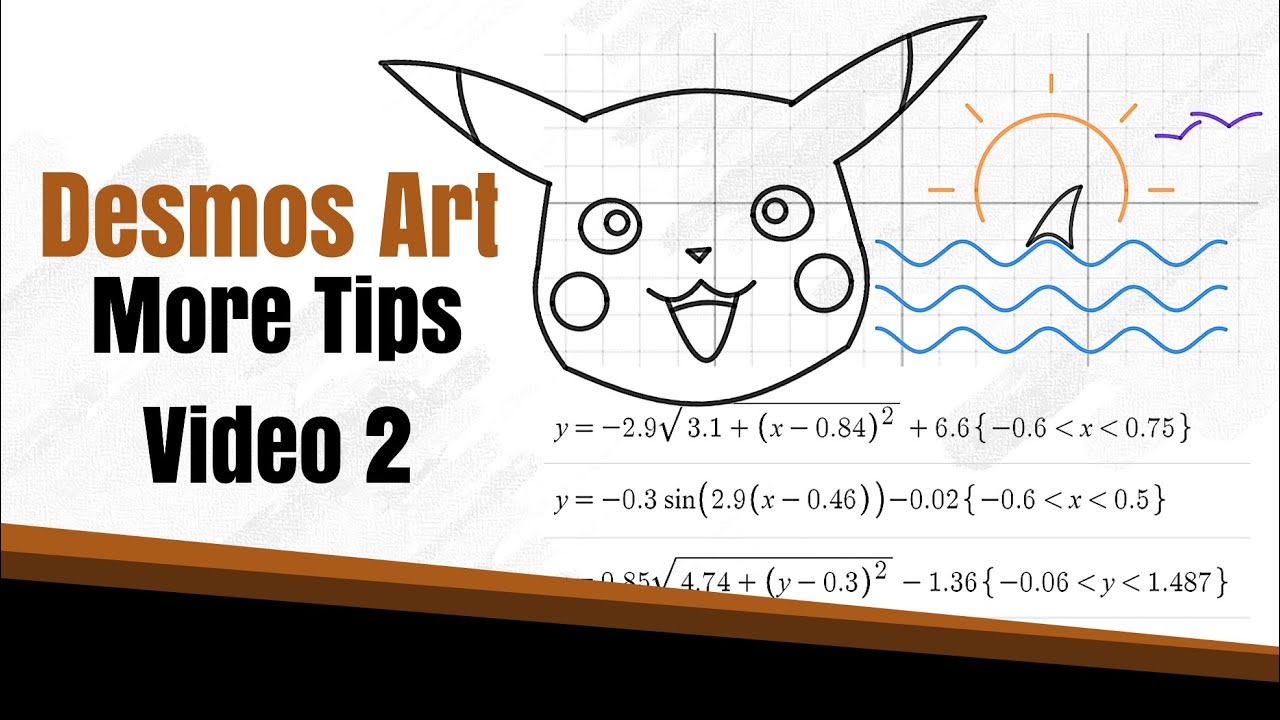
How to Create Desmos Art 2 - Curves, Waves, Ellipses - Step by Step Guide
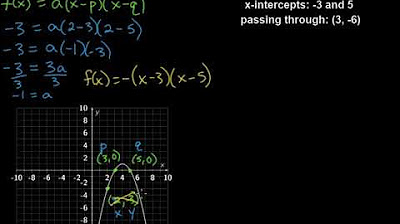
Writing Quadratic Functions in Intercept Form
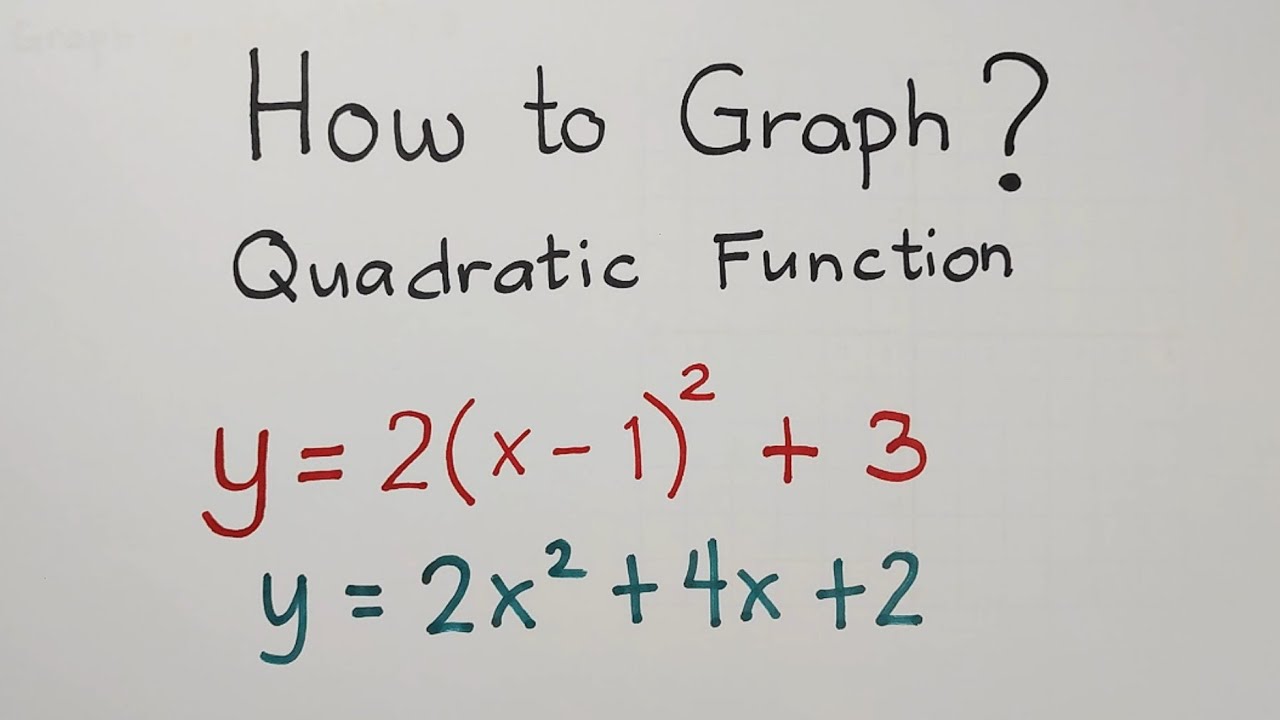
How to Graph a Quadratic Function? Quadratic Function, Vertex, Axis of Symmetry and Parabola
5.0 / 5 (0 votes)