Unit-5 | Maths-4 Most Important Questions with Explanation | Specially for Back Students | Aktu Exam
Summary
TLDRThis video covers the chi-square test, demonstrating its application through two examples. First, it explains how to test whether a vaccine prevents disease using observed and expected values. Then, it applies the test to determine if the color of a son's eyes is associated with the father's eye color. The process involves setting up a contingency table, calculating observed and expected values, and comparing the calculated chi-square value to the critical value to determine whether the null hypothesis is accepted or rejected. The video concludes with an explanation of how to interpret the results in the context of both examples.
Takeaways
- 😀 The Chi-square test is used to determine if there is a significant association between two categorical variables.
- 😀 The null hypothesis assumes no association between the variables being tested.
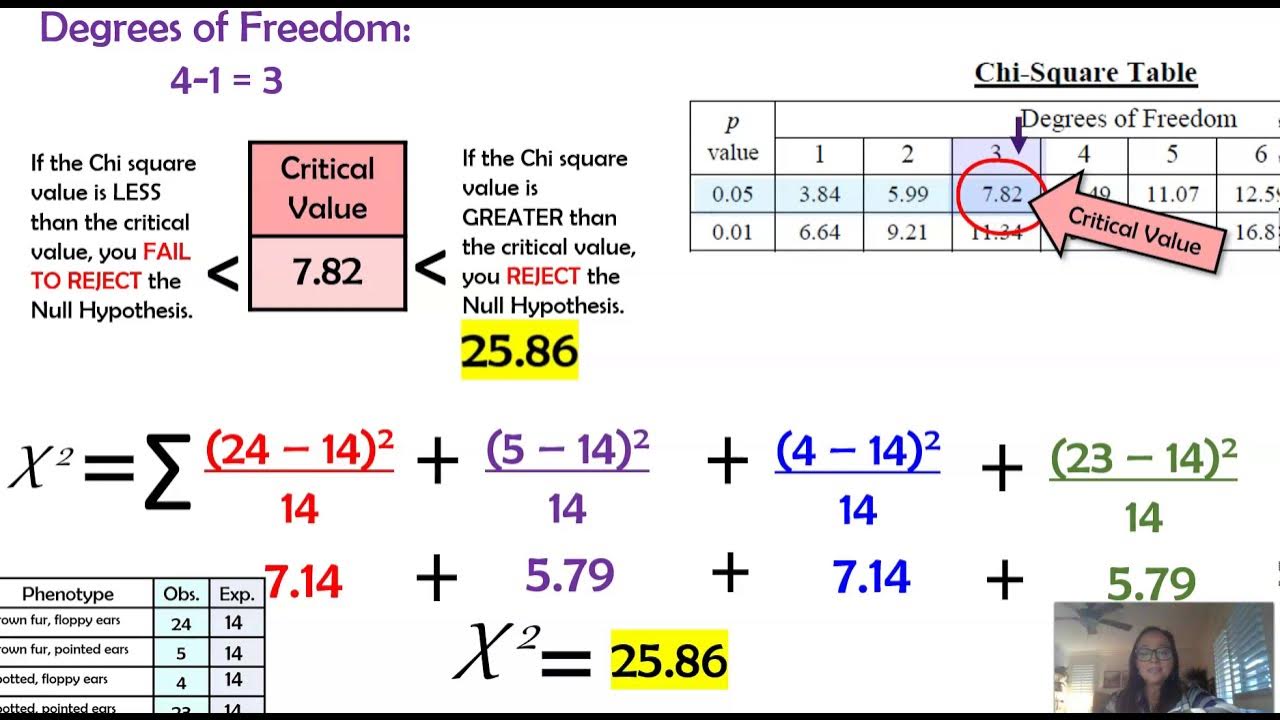
- 😀 The formula for the Chi-square test is: (O - E)^2 / E, where O is the observed frequency and E is the expected frequency.
- 😀 A contingency table is used to summarize observed values and calculate expected values for the Chi-square test.
- 😀 The degrees of freedom for the Chi-square test is calculated as (r - 1) * (c - 1), where r is the number of rows and c is the number of columns.
- 😀 After calculating the Chi-square statistic, it is compared to a critical value from the Chi-square distribution table.
- 😀 If the calculated Chi-square value is greater than the critical value from the table, the null hypothesis is rejected.
- 😀 A rejected null hypothesis indicates a significant association between the variables being tested.
- 😀 The Chi-square test involves observing the difference between the expected and observed frequencies, squaring the difference, and dividing by the expected value.
- 😀 An example of using the Chi-square test is determining whether a son's eye color is associated with the father's eye color using a contingency table.
- 😀 The video emphasizes the importance of summing the rows and columns correctly when creating a contingency table and calculating expected frequencies.
Q & A
What is the formula used for the chi-square test?
-The formula for the chi-square test is: χ² = Σ((O - E)² / E), where O represents the observed value and E represents the expected value.
How is the chi-square test used in hypothesis testing?
-In hypothesis testing, the chi-square test is used to compare observed values against expected values to determine whether there is a significant difference between them. A high chi-square value indicates a significant difference, leading to the rejection of the null hypothesis.
What is the importance of the degree of freedom in the chi-square test?
-The degree of freedom (df) is used to determine the critical value for the chi-square test. It is calculated as (r - 1) * (s - 1), where r is the number of rows and s is the number of columns in the contingency table. The degree of freedom helps to decide if the calculated chi-square value is significant.
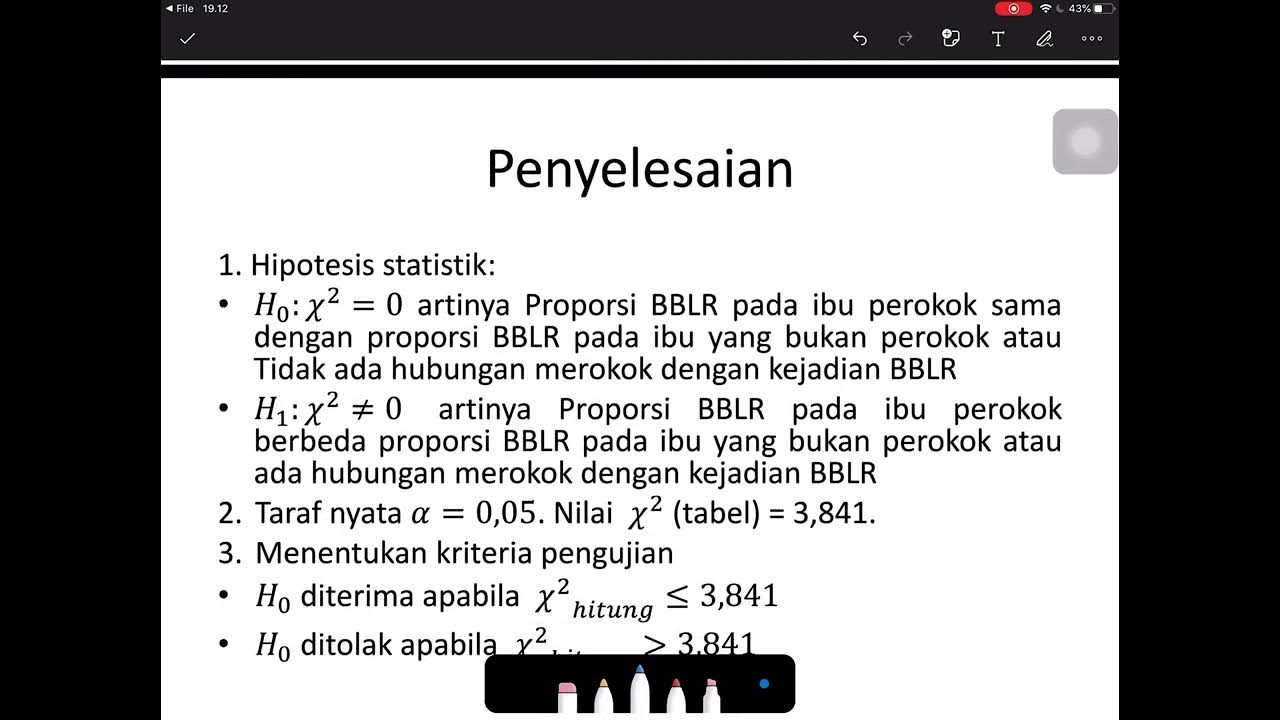
How do you determine if a null hypothesis should be accepted or rejected in the chi-square test?
-The null hypothesis is rejected if the calculated chi-square value is greater than the tabular (critical) value obtained from the chi-square distribution table at the chosen significance level (usually 0.05). If the calculated value is less than the tabular value, the null hypothesis is accepted.
What is a contingency table and why is it important in a chi-square test?
-A contingency table is used to organize observed and expected frequencies in a matrix format, showing the relationship between two categorical variables. It is crucial for performing the chi-square test as it helps calculate the expected values for the test.
What does the term 'observed value' refer to in the chi-square test?
-The 'observed value' (O) refers to the actual data or frequencies that have been collected from an experiment or survey. These values are compared against the expected values to assess the significance of any differences.
What does the term 'expected value' mean in the context of the chi-square test?
-The 'expected value' (E) is the theoretical frequency that would be observed if the null hypothesis were true. It is calculated based on the distribution and proportions of the categories being tested.
What does it mean when the chi-square calculated value is greater than the tabular value?
-When the chi-square calculated value is greater than the tabular value, it indicates that the difference between the observed and expected values is statistically significant. As a result, the null hypothesis is rejected.
What was the null hypothesis in the example regarding the eye color of father and son?
-The null hypothesis in the example was that the color of the son's eyes is not associated with the color of the father's eyes, implying that the two variables are independent.
How are the row and column totals used in the contingency table for the chi-square test?
-In the contingency table, the row totals and column totals are used to calculate the expected values. The row totals are multiplied by the column totals, and the results are then divided by the grand total to find the expected frequency for each cell in the table.
Outlines

此内容仅限付费用户访问。 请升级后访问。
立即升级Mindmap

此内容仅限付费用户访问。 请升级后访问。
立即升级Keywords

此内容仅限付费用户访问。 请升级后访问。
立即升级Highlights

此内容仅限付费用户访问。 请升级后访问。
立即升级Transcripts

此内容仅限付费用户访问。 请升级后访问。
立即升级浏览更多相关视频

UJI CHI-SQUARE TEORI DAN CONTOH KASUS PART 1
Uji Chi Square (Contoh soal dan penyelesaian)

SYARAT MENGGUNAKAN UJI CHI SQUARE DAN FISHER EXACT

Test for Goodness of Fit - Problem 1 - Chi Square Test - Engineering Mathematics 4
Chi Square in Genetics & Examples (AP Biology)

Chi-Square Test [Simply explained]
5.0 / 5 (0 votes)
