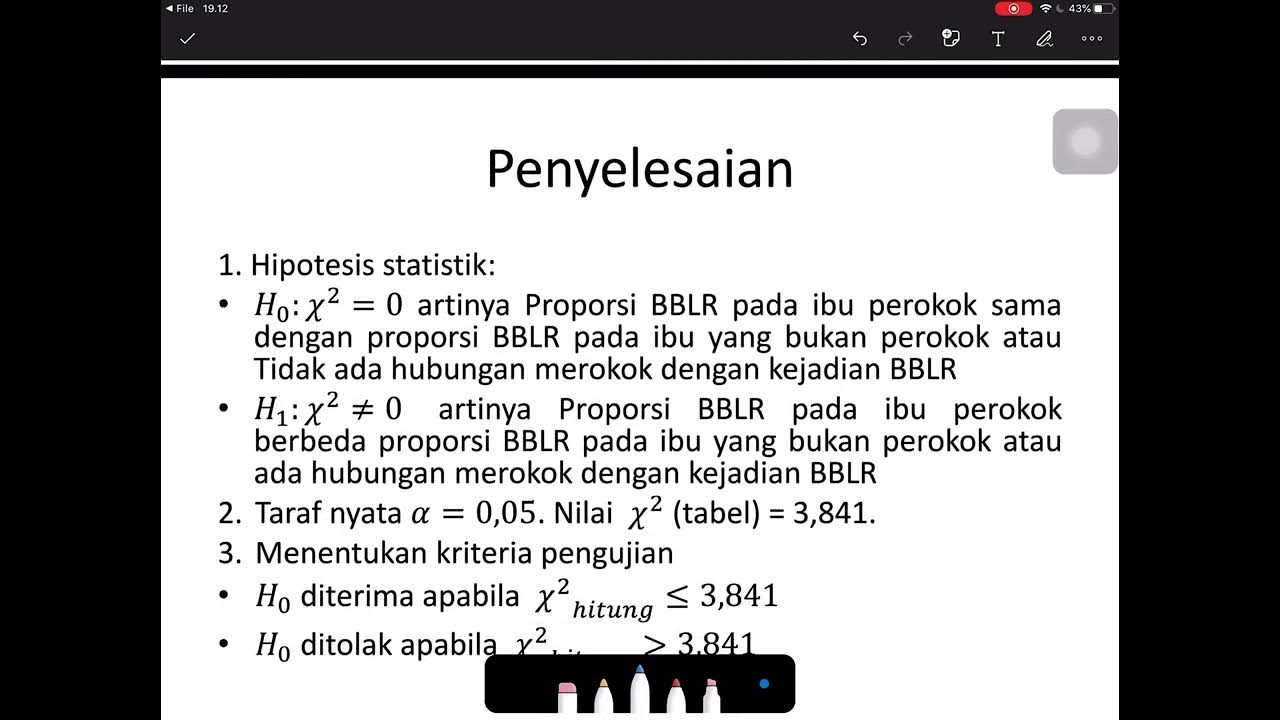
UJI CHI-SQUARE TEORI DAN CONTOH KASUS PART 1
Summary
TLDRThis video lecture provides a comprehensive explanation of the Chi-Square test for independent samples, focusing on its application for testing differences in proportions between groups. The Chi-Square test, commonly used in categorical data analysis, assesses the relationship between two variables through contingency tables. The lecture walks through the construction of contingency tables, calculation of expected frequencies, and step-by-step hypothesis testing. A real-world example is included, where the relationship between age at first childbirth and cancer risk is analyzed. The result concludes that age at childbirth significantly influences the likelihood of developing cancer, highlighting the test's practical application.
Takeaways
- 😀 Chi-Square test is used to assess if there is a significant relationship between two categorical variables.
- 😀 The test compares observed frequencies to expected frequencies in a contingency table.
- 😀 A contingency table organizes data into rows (variables) and columns (categories), showing the frequency of each category combination.
- 😀 The data used in the Chi-Square test must be on a nominal scale, and each expected frequency should be greater than 5.
- 😀 The degrees of freedom for a Chi-Square test are calculated as (number of rows - 1) × (number of columns - 1).
- 😀 The Chi-Square statistic is calculated using the formula: χ² = Σ[(O_ij - E_ij)² / E_ij], where O_ij is the observed frequency and E_ij is the expected frequency.
- 😀 Hypothesis testing in Chi-Square involves the null hypothesis (H₀) stating no relationship and the alternative hypothesis (H₁) stating there is a relationship.
- 😀 The null hypothesis is rejected if the Chi-Square statistic is greater than the critical value from the Chi-Square distribution table, or if the p-value is less than the significance level (α).
- 😀 The lecturer explains the process using a real example where a study tested the relationship between age at first childbirth and cancer diagnosis.
- 😀 In the example, the null hypothesis (H₀) was rejected because the calculated Chi-Square statistic was greater than the critical value, indicating a significant relationship between age at childbirth and cancer.
- 😀 The Chi-Square test is a useful tool in statistical analysis when comparing categorical data across different groups.
Q & A
What is the primary purpose of the Chi-square test?
-The primary purpose of the Chi-square test is to test whether there is a significant difference in the proportions between two or more groups or if there is a relationship between two categorical variables.
What are the conditions required to use the Chi-square test?
-The conditions for using the Chi-square test are: the data must be categorical (nominal scale), the expected frequency for each cell in the contingency table must be greater than five, and the data should be organized in a contingency table.
What is a contingency table, and how is it used in the Chi-square test?
-A contingency table is a frequency table that displays the relationship between two categorical variables. In the Chi-square test, it is used to organize the observed frequencies of combinations of categories from both variables.
Can you explain how to calculate the Chi-square statistic?
-The Chi-square statistic is calculated using the formula: χ² = Σ (O - E)² / E, where O is the observed frequency and E is the expected frequency for each cell in the contingency table.
What are the degrees of freedom in the Chi-square test, and how are they calculated?
-The degrees of freedom for the Chi-square test are calculated as: (number of rows - 1) * (number of columns - 1) in the contingency table.
What is the null hypothesis in a Chi-square test?
-The null hypothesis (H0) in a Chi-square test typically states that there is no relationship or difference between the two categorical variables being tested.
What decision rule is used in the Chi-square test to reject or fail to reject the null hypothesis?
-The null hypothesis is rejected if the calculated Chi-square statistic is greater than the critical value from the Chi-square distribution table, or if the p-value is less than the significance level (alpha).
How do you interpret a Chi-square value that is larger than the table value?
-If the calculated Chi-square value is larger than the table value, it indicates that there is a statistically significant difference between the observed and expected frequencies, leading to the rejection of the null hypothesis.
In the provided example, how is the Chi-square test applied to the relationship between age at first childbirth and cancer?
-In the example, the Chi-square test is used to examine if there is a relationship between age at first childbirth (above or below 30 years old) and the occurrence of cancer. The calculated Chi-square statistic is compared with the critical value to test the hypothesis.
What alternative statistical test is briefly mentioned, and when is it used?
-Fisher's Exact Test is briefly mentioned as an alternative to the Chi-square test. It is used when the sample size is small or when expected frequencies in the contingency table are less than five.
Outlines

This section is available to paid users only. Please upgrade to access this part.
Upgrade NowMindmap

This section is available to paid users only. Please upgrade to access this part.
Upgrade NowKeywords

This section is available to paid users only. Please upgrade to access this part.
Upgrade NowHighlights

This section is available to paid users only. Please upgrade to access this part.
Upgrade NowTranscripts

This section is available to paid users only. Please upgrade to access this part.
Upgrade NowBrowse More Related Video

BAB V STATISTIKA NON PARAMETRIK|INDEPENDENT SAMPLE|STATISTIKA TERAPAN|Part II

Uji Anova Satu Arah (One Way ANOVA): Cara Mengolah Menggunakan SPSS

Uji Chi Square (Contoh soal dan penyelesaian)

Choosing which statistical test to use: Practice examples

Understanding Chi-Square and Fisher's Exact Tests

Statistical Tests: Choosing which statistical test to use
5.0 / 5 (0 votes)