*M* Uji Kecocokan: Frekuensi yang Diduga Sama dan yang Tidak Sama dengan Microsoft Excel dan SPSS
Summary
TLDRThis video tutorial explains the Chi-Square Goodness of Fit test, a statistical method used to compare observed and expected frequencies in categorical data. The script covers key steps such as hypothesis testing, choosing significance levels, calculating the chi-square statistic, and making decisions based on the results. It also highlights how to apply this method using SPSS software, including data import from Excel and interpreting the output. The tutorial aims to help viewers understand the theory and practical application of the chi-square test in real-world scenarios like survey analysis and frequency distribution comparison.
Takeaways
- 😀 The chi-square goodness of fit test is used to compare observed frequencies with expected frequencies to see if there is a significant difference.
- 😀 This test is commonly used in statistics and can be applied when data is categorized into groups.
- 😀 The purpose of the chi-square test is to determine if the observed distribution of data matches an expected distribution.
- 😀 The example in the script involves a survey on food preferences, comparing the observed vs. expected frequencies of preferences for chicken, fish, meat, and pasta.
- 😀 The chi-square test follows five key steps: stating hypotheses, choosing a significance level, selecting the chi-square statistic, establishing decision rules, and calculating the chi-square statistic.
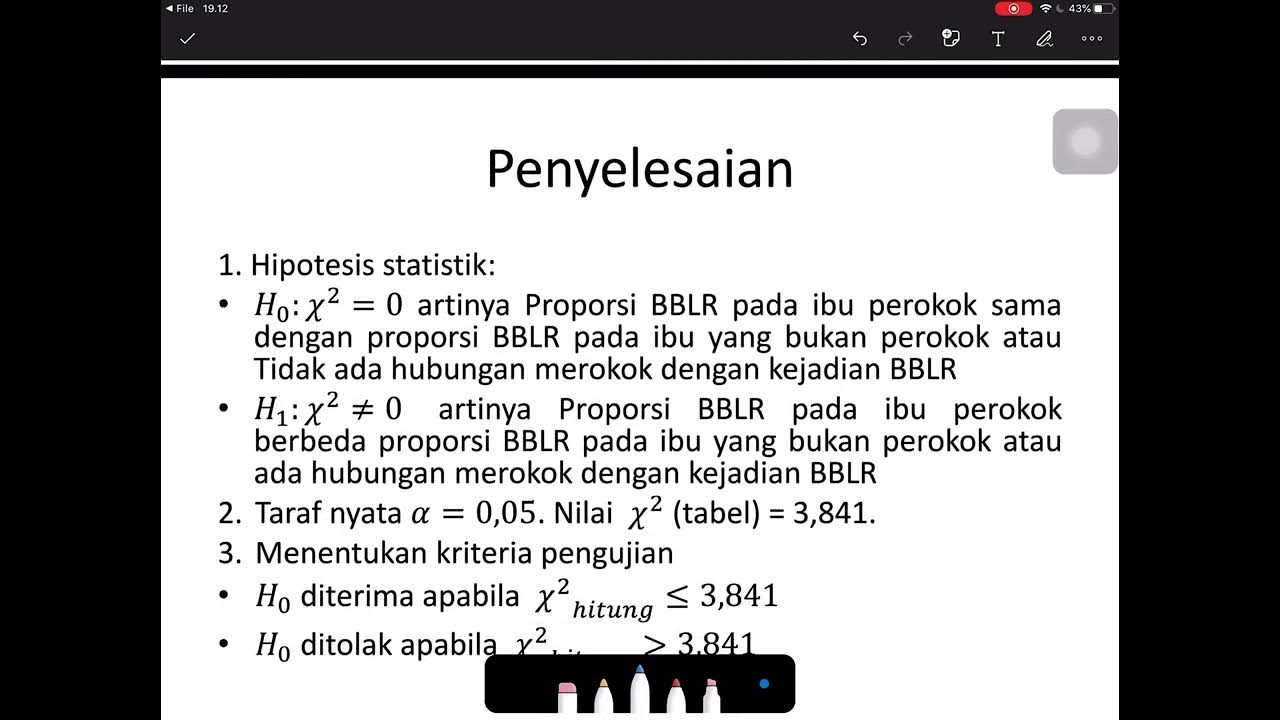
- 😀 The null hypothesis (H0) assumes no difference between observed and expected frequencies, while the alternative hypothesis (H1) suggests there is a difference.
- 😀 The significance level chosen for the test is typically 0.05, meaning there's a 5% chance of rejecting the null hypothesis when it is actually true.
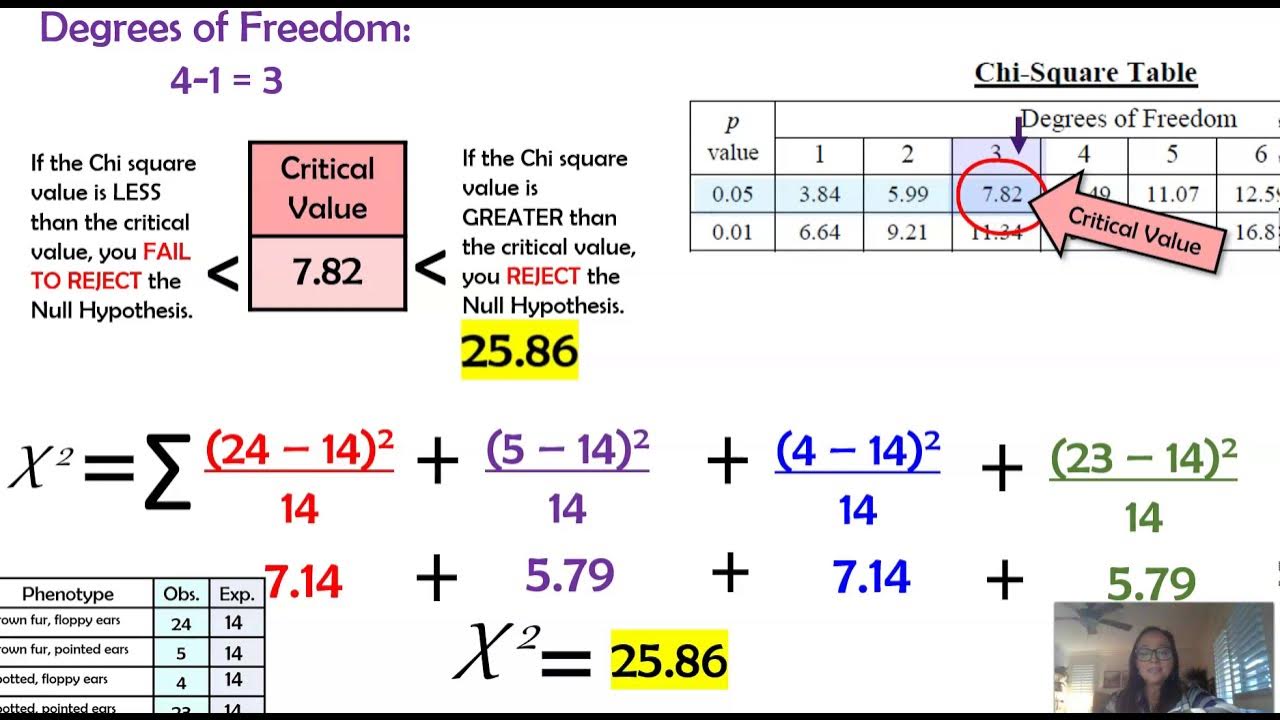
- 😀 The chi-square statistic is calculated using a formula that involves the sum of squared differences between observed and expected frequencies, divided by the expected frequencies.
- 😀 A chi-square distribution is always positive and can have a variety of shapes depending on the degrees of freedom and sample size.
- 😀 In SPSS, the chi-square test can be performed by inputting data, selecting the chi-square test option, and reviewing the output, which includes the chi-square statistic and p-value.
- 😀 The final decision on the hypothesis is based on whether the calculated chi-square statistic exceeds the critical value. If it does, the null hypothesis is rejected, suggesting a significant difference.
Q & A
What is the Chi-Square test and when is it used?
-The Chi-Square test is a statistical method used to determine if there is a significant difference between observed and expected frequencies in categorical data. It is often used in hypothesis testing, particularly when you are comparing observed data with a theoretical model or when analyzing categorical survey data.
What is the purpose of the Chi-Square goodness of fit test?
-The purpose of the Chi-Square goodness of fit test is to compare the observed distribution of a categorical variable with an expected distribution. It helps to determine if the observed frequencies differ significantly from what is expected under a given hypothesis.
What are the steps involved in performing a Chi-Square test?
-The steps in performing a Chi-Square test include: 1) stating the null and alternative hypotheses, 2) choosing the significance level, 3) calculating the Chi-Square statistic, 4) determining the critical value from the Chi-Square distribution, and 5) making a decision to either reject or fail to reject the null hypothesis.
How is the Chi-Square statistic calculated?
-The Chi-Square statistic is calculated using the formula: χ² = Σ [(O - E)² / E], where O represents the observed frequency and E represents the expected frequency for each category.
What does the degree of freedom (df) represent in a Chi-Square test?
-The degree of freedom (df) in a Chi-Square test represents the number of categories minus one (df = k - 1), where k is the number of categories being analyzed. It is used to determine the critical value from the Chi-Square distribution table.
What does it mean to reject the null hypothesis in a Chi-Square test?
-Rejecting the null hypothesis in a Chi-Square test means that there is enough evidence to conclude that the observed data significantly differs from the expected frequencies. This suggests that the null hypothesis, which posits no difference or no effect, is unlikely to be true.
What is the significance level (α) in a Chi-Square test?
-The significance level (α) is the probability threshold below which the null hypothesis will be rejected. A common value for α is 0.05, meaning there is a 5% chance of incorrectly rejecting the null hypothesis if it is true.
What is a critical value in the context of the Chi-Square test?
-The critical value in a Chi-Square test is the value from the Chi-Square distribution table that corresponds to the degrees of freedom and the chosen significance level (α). If the Chi-Square statistic exceeds the critical value, the null hypothesis is rejected.
How does SPSS help in performing a Chi-Square test?
-SPSS simplifies the process of performing a Chi-Square test by allowing users to input data, choose the Chi-Square test from the statistical options, and automatically calculate the Chi-Square statistic, degrees of freedom, and p-value, which helps in decision-making.
Can you give an example of applying the Chi-Square test to real-world data?
-In the video, an example was given where data from a survey of 120 adults about their food preferences (chicken, fish, beef, and pasta) was compared to expected frequencies. The Chi-Square test showed no significant preference for any particular food, meaning the observed distribution was not significantly different from the expected distribution.
Outlines

This section is available to paid users only. Please upgrade to access this part.
Upgrade NowMindmap

This section is available to paid users only. Please upgrade to access this part.
Upgrade NowKeywords

This section is available to paid users only. Please upgrade to access this part.
Upgrade NowHighlights

This section is available to paid users only. Please upgrade to access this part.
Upgrade NowTranscripts

This section is available to paid users only. Please upgrade to access this part.
Upgrade Now5.0 / 5 (0 votes)


