Uji Chi Square (Contoh soal dan penyelesaian)
Summary
TLDRThis video explains the chi-square test (uji chi-square), its purpose, and application in statistical analysis. It highlights the test’s use with nominal variables, such as gender, to assess the relationship between two categorical variables. The process includes formulating hypotheses, calculating expected frequencies, and comparing the chi-square statistic to the critical value. An example study on smoking and low birth weight is used to demonstrate the test’s steps, leading to the conclusion that smoking is linked to low birth weight. Viewers gain a clear understanding of hypothesis testing using chi-square in research.
Takeaways
- 😀 The Chi-Square test is used to assess the relationship between two nominal variables, such as gender or smoking habits.
- 😀 Nominal data consists of categories without any inherent order, e.g., male/female or smoker/non-smoker.
- 😀 Chi-Square values are always positive and follow a distribution that extends towards the positive direction.
- 😀 Unlike t-tests or z-tests, Chi-Square values cannot be negative; they always range from zero upwards.
- 😀 The Chi-Square test compares observed frequencies with expected frequencies to determine if there is a significant relationship.
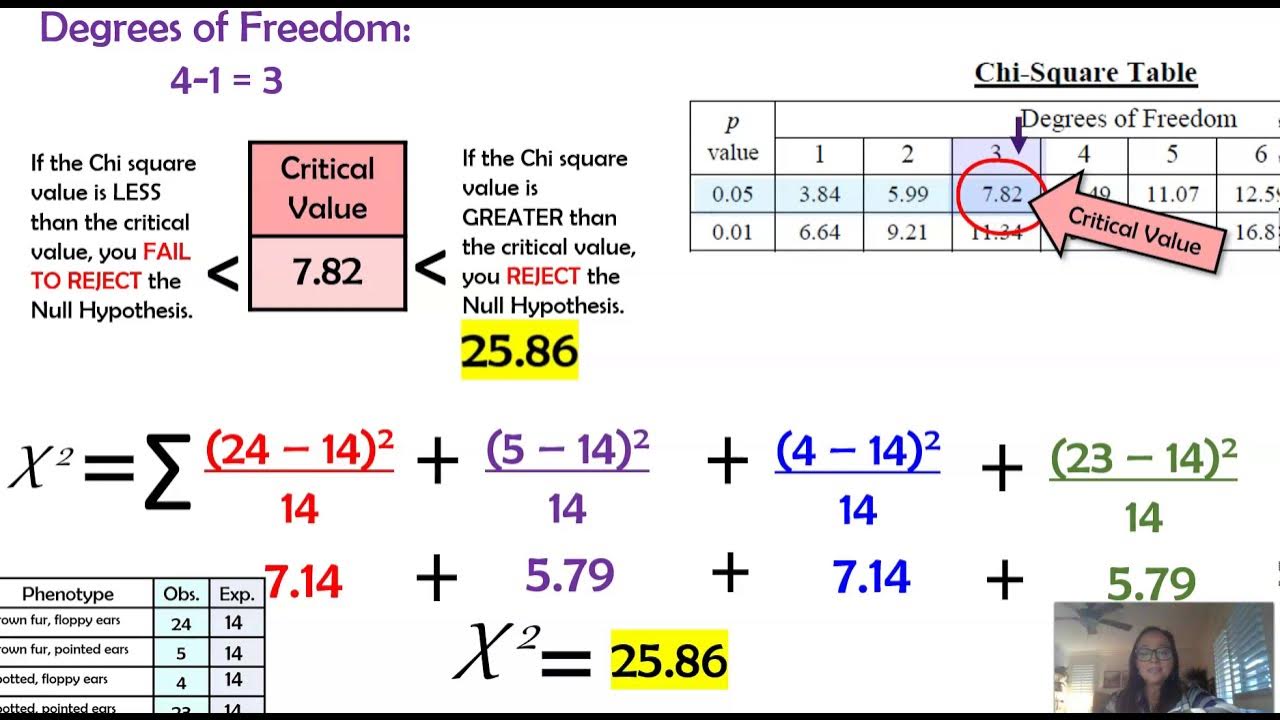
- 😀 To calculate Chi-Square, the formula is: χ² = Σ((O_i - E_i)² / E_i), where O_i is the observed frequency, and E_i is the expected frequency.
- 😀 The degree of freedom (DF) is calculated as: DF = (number of rows - 1) * (number of columns - 1).
- 😀 The Chi-Square hypothesis test involves setting up a null hypothesis (H0) stating no relationship, and an alternative hypothesis (H1) stating there is a relationship.
- 😀 Critical values for Chi-Square are determined from Chi-Square tables based on the degree of freedom and significance level (α), typically 0.05 or 0.01.
- 😀 In the given example, a study on smoking mothers and low birth weight found a significant relationship when Chi-Square calculated (4.9) exceeded the table value (3.84).
Please replace the link and try again.
Outlines

This section is available to paid users only. Please upgrade to access this part.
Upgrade NowMindmap

This section is available to paid users only. Please upgrade to access this part.
Upgrade NowKeywords

This section is available to paid users only. Please upgrade to access this part.
Upgrade NowHighlights

This section is available to paid users only. Please upgrade to access this part.
Upgrade NowTranscripts

This section is available to paid users only. Please upgrade to access this part.
Upgrade NowBrowse More Related Video

*M* Uji Kecocokan: Frekuensi yang Diduga Sama dan yang Tidak Sama dengan Microsoft Excel dan SPSS
Chi Square in Genetics & Examples (AP Biology)

How to calculate a Chi-Square Test?

Test for Goodness of Fit - Problem 1 - Chi Square Test - Engineering Mathematics 4

Understanding Chi-Square and Fisher's Exact Tests

video 14.2. chi-square test of independence
5.0 / 5 (0 votes)