QGIS Remote Sensing - Calculate NDVI
Summary
TLDRIn this tutorial, viewers are guided through the process of calculating NDVI (Normalized Difference Vegetation Index) in QGIS using Landsat 8 imagery. The video explains how to identify relevant Landsat bands, perform the NDVI calculation with QGIS's Raster Calculator, and adjust the symbology for effective visualization. It also covers key concepts behind NDVI, including how vegetation reflects near-infrared light and absorbs red light. This tutorial is ideal for beginners looking to apply remote sensing techniques to analyze vegetation health and learn the basics of QGIS.
Takeaways
- 😀 NDVI (Normalized Difference Vegetation Index) is a key tool used to analyze vegetation using satellite imagery.
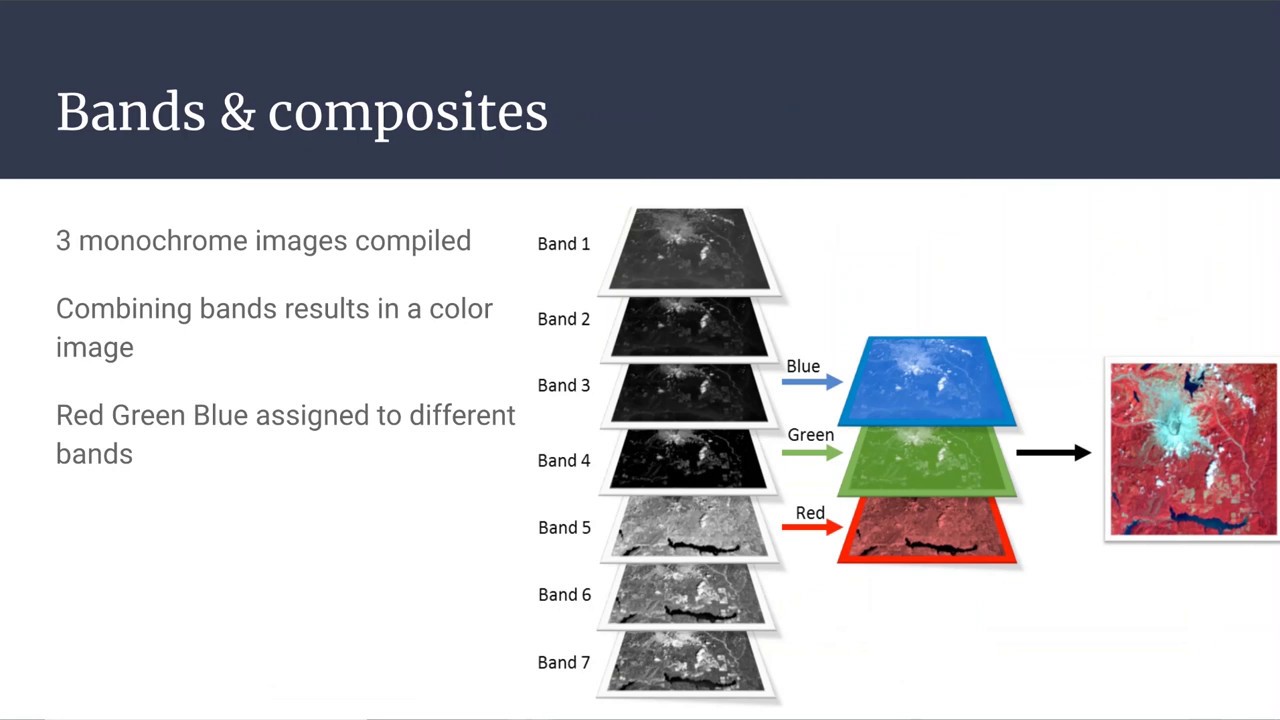
- 😀 NDVI is calculated using the formula: (NIR - Red) / (NIR + Red), where NIR is the Near-Infrared band (Band 5) and Red is the Red band (Band 4).
- 😀 Vegetation reflects high amounts of near-infrared light and absorbs red light, making NDVI values high in areas with healthy vegetation.
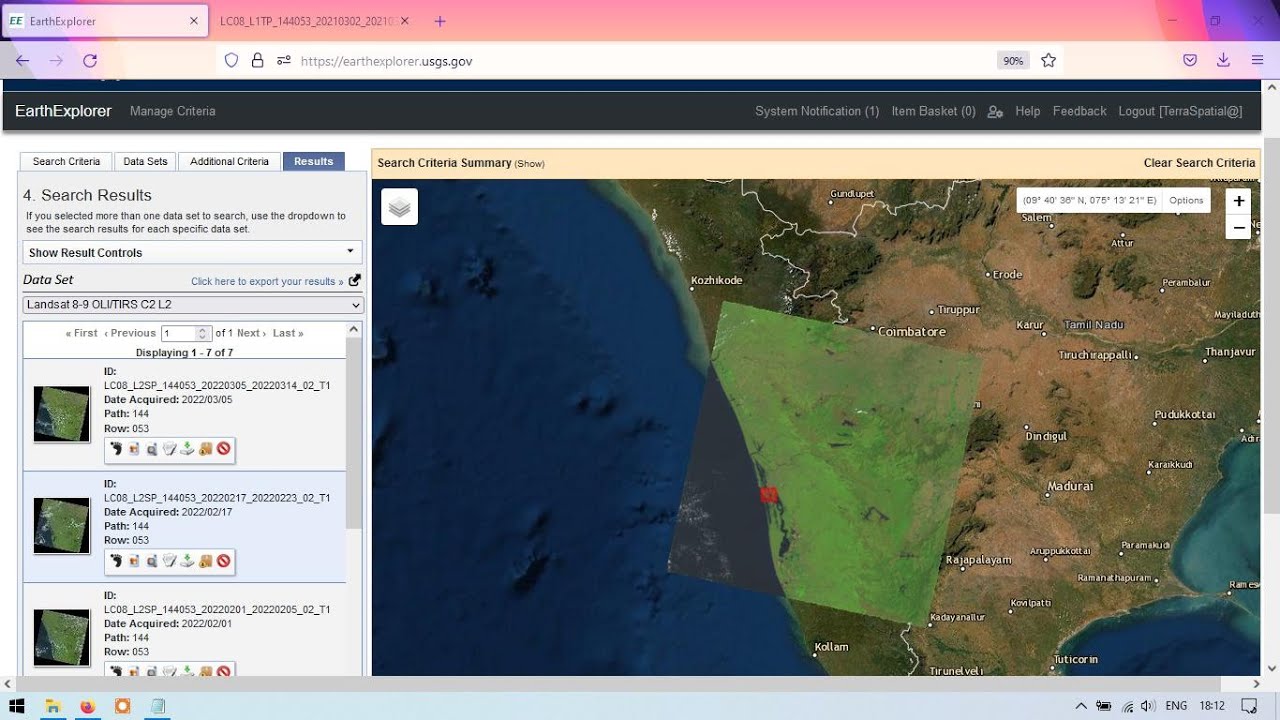
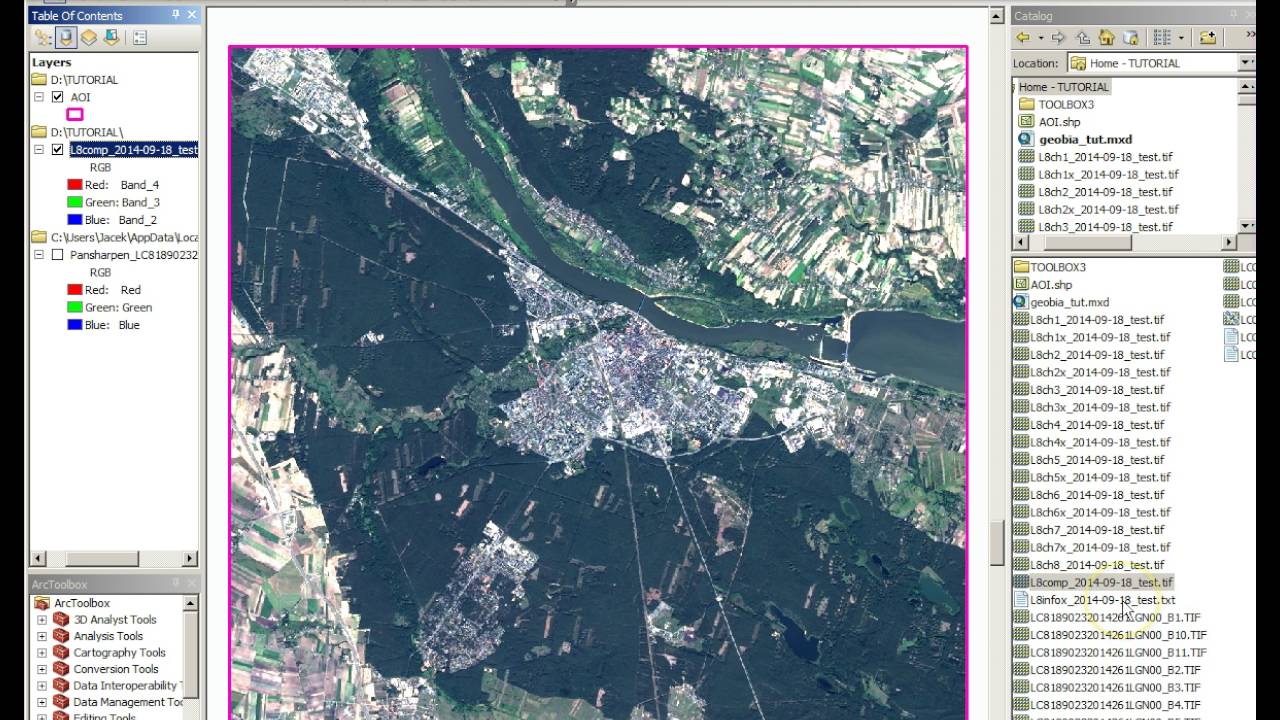
- 😀 Landsat 8 bands 4 (Red) and 5 (NIR) are used for calculating NDVI in this tutorial.
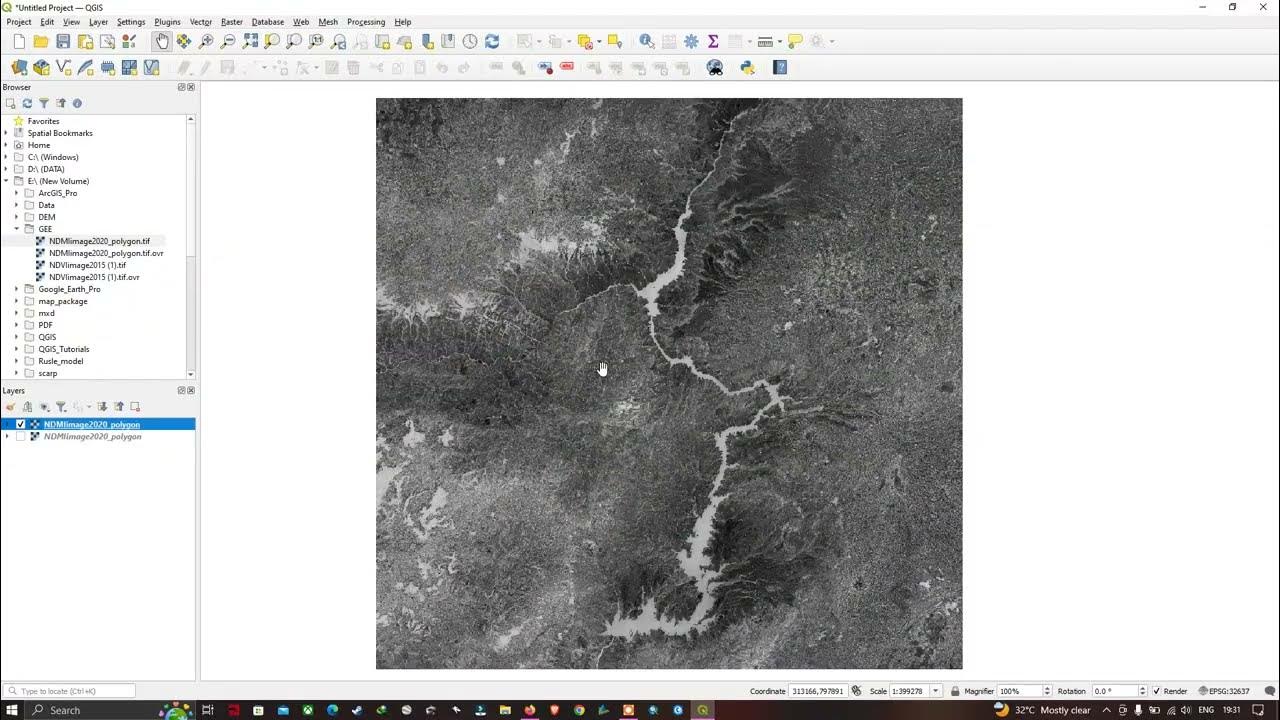
- 😀 The Raster Calculator in QGIS is used to perform the NDVI calculation using the specified formula.
- 😀 You can access the Raster Calculator by typing it in the QGIS search bar and selecting the QGIS version of it.
- 😀 When entering the NDVI formula, the order of subtraction (NIR - Red) matters, but for the addition (NIR + Red), the order doesn’t.
- 😀 After performing the calculation, save the output as a TIFF file for future use and analysis.
- 😀 Symbology for the NDVI result can be adjusted to display the values in a visually meaningful way using color ramps and intervals.
- 😀 The tutorial includes instructions on how to adjust the color scheme in QGIS to better visualize areas with high or low NDVI values.
- 😀 The tutorial emphasizes that understanding NDVI and how to calculate it is important for remote sensing applications like vegetation monitoring.
Q & A
What is NDVI, and why is it important in remote sensing?
-NDVI (Normalized Difference Vegetation Index) is a measure used in remote sensing to assess vegetation health. It calculates the difference between near-infrared light, which is reflected by healthy vegetation, and red light, which is absorbed by plants. NDVI values help identify vegetation coverage and its health, with higher values indicating healthier vegetation.
Which Landsat 8 bands are used to calculate NDVI?
-To calculate NDVI, you use Band 4 (red) and Band 5 (near-infrared) from Landsat 8 imagery. Band 4 corresponds to the red portion of the visible spectrum, and Band 5 corresponds to the near-infrared portion.
How do you calculate NDVI using the Raster Calculator in QGIS?
-In QGIS, NDVI is calculated by entering the formula: (Band 5 - Band 4) / (Band 5 + Band 4) in the Raster Calculator. Band 5 represents near-infrared, and Band 4 represents red light. This formula helps distinguish between areas with healthy vegetation (high NDVI values) and those without vegetation (low NDVI values).
What does NDVI tell us about different land cover types?
-NDVI values help distinguish between vegetation-covered areas and non-vegetated areas. High NDVI values indicate healthy or dense vegetation, while low or negative values typically correspond to water bodies, barren land, or areas with little to no vegetation.
What role does symbology play in interpreting NDVI results in QGIS?
-Symbology in QGIS is used to visually represent the NDVI values. By adjusting the color ramp and classification intervals, you can highlight areas with high or low NDVI values, making it easier to interpret and understand the vegetation health across the map.
Why does the order of the bands matter when entering the NDVI formula in QGIS?
-The order of bands matters in the NDVI formula for the subtraction part. Specifically, Band 5 (near-infrared) should be the numerator, and Band 4 (red) should be the denominator. This ensures that the correct difference between the near-infrared and red wavelengths is calculated.
What is the significance of setting a reference layer when using the Raster Calculator in QGIS?
-The reference layer in QGIS ensures that the cell size, output extent, and coordinate reference system (CRS) are consistent with the other layers in the project. This is crucial for maintaining spatial accuracy when performing raster calculations.
How can adjusting the color ramp and classification improve NDVI visualization in QGIS?
-Adjusting the color ramp and classification intervals helps improve the clarity and interpretability of the NDVI output. For example, using distinct colors for high, medium, and low NDVI values allows you to easily differentiate areas with healthy vegetation from those without vegetation.
Why do areas like water bodies have low NDVI values?
-Water bodies have low NDVI values because water absorbs near-infrared light and does not reflect it as vegetation does. As a result, water has a much lower NDVI value compared to vegetation, which reflects more near-infrared light.
How can understanding NDVI benefit various fields like agriculture or environmental monitoring?
-NDVI is widely used in fields like agriculture and environmental monitoring to assess crop health, monitor drought conditions, detect deforestation, and manage ecosystems. It provides insights into vegetation stress, growth patterns, and land cover changes, helping inform decisions for better land management.
Outlines

此内容仅限付费用户访问。 请升级后访问。
立即升级Mindmap

此内容仅限付费用户访问。 请升级后访问。
立即升级Keywords

此内容仅限付费用户访问。 请升级后访问。
立即升级Highlights

此内容仅限付费用户访问。 请升级后访问。
立即升级Transcripts

此内容仅限付费用户访问。 请升级后访问。
立即升级浏览更多相关视频


5.0 / 5 (0 votes)
