Por que o NDVI mede a densidade de vegetação verde?
Summary
TLDRIn this video, Marcelo from Portal Expert discusses the NDVI (Normalized Difference Vegetation Index), a key tool in precision agriculture for assessing vegetation health using remote sensing techniques. He explains how NDVI works by comparing the reflectance of near-infrared and red light to quantify biomass and plant vigor. The video also highlights how vegetation interacts with electromagnetic radiation, and the importance of understanding spectral signatures. Marcelo demonstrates the use of NDVI for analyzing crop growth and diagnosing vegetation stress, emphasizing the need for careful interpretation of data, especially in areas with dense vegetation.
Takeaways
- 😀 NDVI (Normalized Difference Vegetation Index) is the most widely used vegetation index, helping assess vegetation biomass by calculating the ratio between the near-infrared and red spectral bands.
- 😀 Vegetation interacts with electromagnetic radiation, absorbing certain wavelengths for photosynthesis and reflecting others, particularly in the green and near-infrared ranges.
- 😀 Vegetation absorbs blue and red wavelengths and reflects green and near-infrared light, which is why plants appear green to our eyes.
- 😀 The near-infrared reflectance is strongly influenced by the internal structure of leaves, which is why plants have high reflectance in this region of the spectrum.
- 😀 The NDVI value helps quantify the density and health of vegetation; higher NDVI values correspond to healthier, denser vegetation, while lower or negative values indicate less or no vegetation.
- 😀 NDVI can be used to monitor vegetation health, stress levels, and changes in agricultural and natural landscapes, especially when analyzing crop growth or forest biomass.
- 😀 NDVI values can be affected by atmospheric conditions, soil variations, sensor calibration, and lighting angles, so these factors should be considered when analyzing NDVI data.
- 😀 NDVI suffers from saturation in areas with dense vegetation, where it can no longer detect an increase in biomass beyond a certain point, making it less effective in highly vegetated areas.
- 😀 The script uses an example of cotton crops to illustrate NDVI application, showing how different NDVI values correlate with healthy vs. stressed vegetation.
- 😀 NDVI can be calculated by using the near-infrared and red bands, with a simple formula: (NIR - Red) / (NIR + Red). This process can be done pixel by pixel in an image analysis software.
- 😀 A key takeaway is the importance of understanding spectral behavior and the NDVI index for precision agriculture, as it helps assess vegetation health and predict productivity in crops or forests.
Q & A
What is NDVI, and why is it important in vegetation analysis?
-NDVI, or Normalized Difference Vegetation Index, is a widely used vegetation index that quantifies biomass and vegetation density. It is calculated by comparing the reflectance of two spectral bands: the near-infrared and red bands. NDVI helps in assessing the health, coverage, and productivity of vegetation, making it crucial in precision agriculture and environmental monitoring.
How does vegetation interact with electromagnetic radiation?
-Vegetation interacts with electromagnetic radiation by reflecting, absorbing, or transmitting light. Different wavelengths of light are absorbed for processes like photosynthesis, while others are reflected back, especially in the near-infrared spectrum. This interaction helps in the spectral analysis of vegetation health and biomass.
What does the NDVI calculation involve?
-The NDVI is calculated as the difference between the near-infrared band (NIR) and the red band (RED), divided by their sum. This formula highlights the contrast between healthy vegetation, which reflects more near-infrared light, and non-vegetative surfaces.
Why is the near-infrared band significant in vegetation studies?
-The near-infrared band is crucial because it reveals the structural properties of vegetation. Healthy vegetation strongly reflects near-infrared light, which helps distinguish it from other land cover types. This spectral behavior is used in NDVI calculations to assess vegetation health and biomass.
What can cause a decrease in the contrast between red and near-infrared reflectance in vegetation?
-A decrease in the contrast between red and near-infrared reflectance can be caused by stress factors such as water deficiency, thermal stress, or nutritional deficiencies in plants. These stresses reduce the reflectivity of the vegetation in the near-infrared band, impacting the NDVI value.
What are the limitations of NDVI in densely vegetated areas?
-In densely vegetated areas, NDVI can suffer from saturation. As biomass increases, NDVI values plateau and no longer accurately reflect the growth beyond a certain point. This makes NDVI less effective for areas with very high vegetation density.
How do spectral properties of vegetation help in understanding its condition?
-The spectral properties of vegetation, such as the absorption of blue and red wavelengths and the reflection in green and near-infrared bands, provide insights into the plant's health. Vegetation that is healthy absorbs light efficiently for photosynthesis, while stressed or unhealthy vegetation shows altered reflectance patterns.
Why is spectral calibration important when using NDVI?
-Spectral calibration is important to ensure accurate NDVI readings. Variations in atmospheric conditions, soil properties, and sensor calibration can affect the spectral reflectance values. Proper calibration ensures reliable and consistent NDVI values for analysis.
How does the NDVI index relate to biomass and vegetation productivity?
-The NDVI index is directly related to biomass and vegetation productivity. A higher NDVI indicates greater vegetation health and biomass, while lower NDVI values typically correspond to areas with little or no vegetation. This relationship allows for monitoring growth stages and estimating productivity.
How can NDVI be applied in precision agriculture?
-In precision agriculture, NDVI is used to monitor crop health, estimate yields, detect nutrient deficiencies, and manage irrigation. By analyzing NDVI data over time, farmers can optimize input use, improve crop management, and increase overall agricultural efficiency.
Outlines

This section is available to paid users only. Please upgrade to access this part.
Upgrade NowMindmap

This section is available to paid users only. Please upgrade to access this part.
Upgrade NowKeywords

This section is available to paid users only. Please upgrade to access this part.
Upgrade NowHighlights

This section is available to paid users only. Please upgrade to access this part.
Upgrade NowTranscripts

This section is available to paid users only. Please upgrade to access this part.
Upgrade Now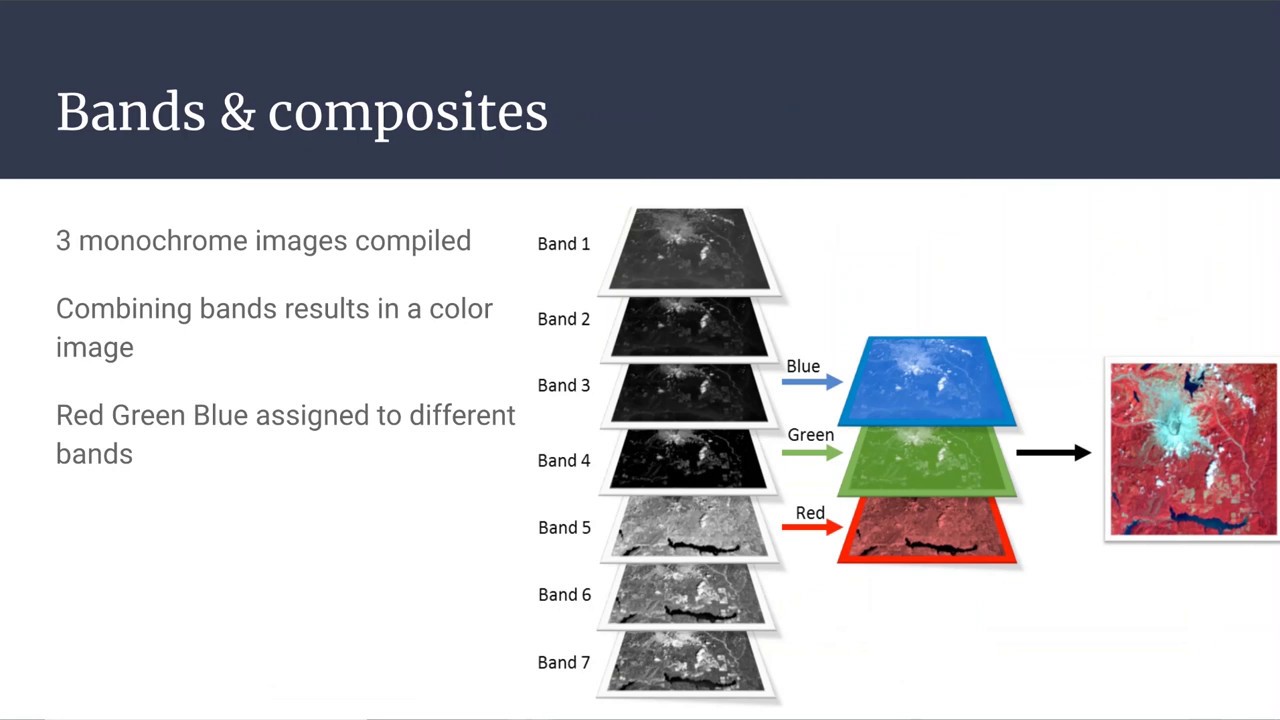


5.0 / 5 (0 votes)