Geog136 Lecture 11.1 Remote sensing basics
Summary
TLDRThis video explains remote sensing techniques for analyzing satellite imagery, focusing on band combinations and indices like NDVI (Normalized Difference Vegetation Index). It covers how different band combinations can be used to visualize features such as vegetation, soil moisture, and urban areas. The video also dives into the calculation of NDVI and its importance in distinguishing healthy vegetation from other land features. Additionally, it discusses other useful indices like NDWI and MSAVI, which are helpful for assessing water content and soil brightness. These techniques are crucial for environmental monitoring, agriculture, and land management.
Takeaways
- 😀 Satellite imagery uses different band combinations to visualize specific features on Earth, such as vegetation or water.
- 🌱 Vegetation appears bright green when visualized with near-infrared in the green band and red in the red band, which emphasizes photosynthetic activity.
- 🔴 A true color image uses bands 4, 3, and 2 to create a standard color representation resembling what humans would see from the ground.
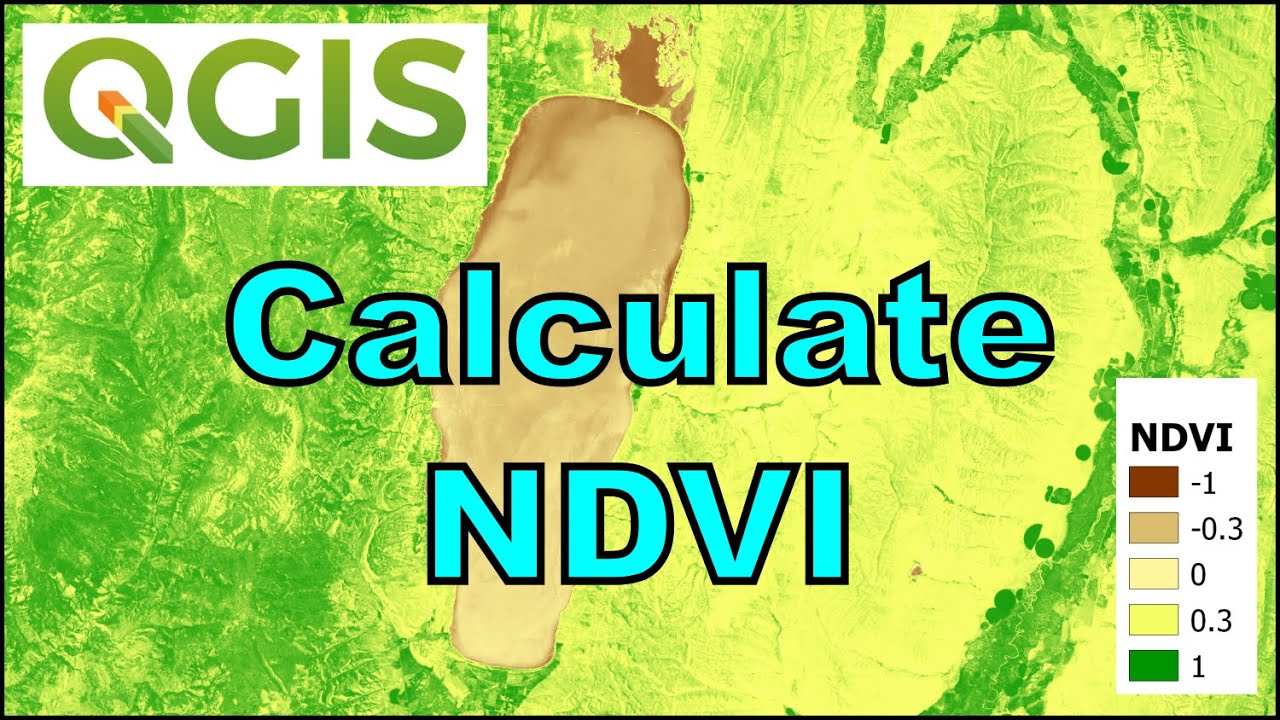
- 🧑🔬 The NDVI (Normalized Difference Vegetation Index) is a common vegetation index, calculated using the ratio of near-infrared and red bands to highlight healthy vegetation.
- 💧 The NDWI (Normalized Difference Water Index) is useful for identifying water bodies and analyzing soil moisture content.
- 🌍 Band combinations, such as 742 (near-infrared in green), help differentiate between healthy vegetation and other land types.
- 🌾 NDVI values range from -1 to 1, with higher values indicating more photosynthetic vegetation, and lower values corresponding to non-vegetated areas.
- 📊 NDVI enhances the distinction between healthy vegetation and barren areas compared to true or false color composites.
- 💡 Indices like NDVI can be used to accentuate subtle differences between land surface types, aiding in more accurate environmental analysis.
- 🔄 The process of combining bands into indices is not complicated; it is a simple mathematical operation, yet it provides valuable insights into land surface characteristics.
Q & A
What is the significance of using different band combinations in remote sensing?
-Using different band combinations helps emphasize specific features on the Earth's surface. For example, by assigning near-infrared bands to visible color channels, remote sensing can highlight vegetation, water bodies, or soil types, enabling better analysis of environmental data.
How does the 742 composite work and what does it emphasize?
-The 742 composite uses near-infrared in the green channel, making vegetation appear bright green, even though it’s visualizing near-infrared light. This composite is useful for highlighting photosynthetic vegetation, which reflects a lot in the near-infrared spectrum.
What does a true color composite represent?
-A true color composite uses bands 4 (Red), 3 (Green), and 2 (Blue) to produce an image resembling what the human eye would see. It shows a photographic-like representation of the landscape.
Why is NDVI (Normalized Difference Vegetation Index) commonly used?
-NDVI is commonly used because it helps distinguish photosynthetic vegetation from other land features. It accentuates areas of high vegetation by calculating the difference between near-infrared and red light reflectance, providing a value that indicates the health and density of vegetation.
How is NDVI calculated?
-NDVI is calculated by subtracting the red band reflectance from the near-infrared reflectance and then dividing the result by the sum of these two values. This ratio helps highlight areas with high photosynthetic activity.
What do high NDVI values indicate?
-High NDVI values, close to 1, indicate areas with healthy, dense vegetation that strongly reflect near-infrared light, such as forests or crops.
What do low NDVI values suggest?
-Low NDVI values, approaching -1, suggest areas with little to no vegetation, such as deserts, glaciers, or barren land, where there is minimal reflectance in the near-infrared spectrum.
What other indices are commonly used alongside NDVI, and for what purpose?
-Other commonly used indices include the Normalized Difference Water Index (NDWI), which detects water bodies and moisture content, and the Modified Soil-Adjusted Vegetation Index (MSAVI), which helps distinguish between soil and vegetation, particularly in areas with bright soil.
What is the primary use of the Modified Soil-Adjusted Vegetation Index (MSAVI)?
-MSAVI is designed to reduce the influence of soil brightness on vegetation analysis, making it particularly useful for studying vegetation in areas where soil reflectance is high, such as semi-arid or dry regions.
How do band ratios accentuate differences between land features?
-Band ratios accentuate differences by comparing the reflectance of one band to another, highlighting subtle variations. For example, comparing the near-infrared band with the red band enhances the visibility of vegetation, which strongly reflects near-infrared light.
Outlines

This section is available to paid users only. Please upgrade to access this part.
Upgrade NowMindmap

This section is available to paid users only. Please upgrade to access this part.
Upgrade NowKeywords

This section is available to paid users only. Please upgrade to access this part.
Upgrade NowHighlights

This section is available to paid users only. Please upgrade to access this part.
Upgrade NowTranscripts

This section is available to paid users only. Please upgrade to access this part.
Upgrade NowBrowse More Related Video
QGIS Remote Sensing - Calculate NDVI

Por que o NDVI mede a densidade de vegetação verde?
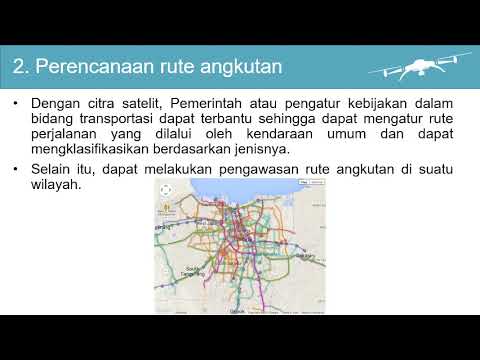
Pengolahan Citra Penginderaan Jauh untuk jaringan transportasi

Bagaimana Cara Mengintepretasikan Citra Penginderaan Jauh?

Pengindraan Jauh | Kelas X SMA
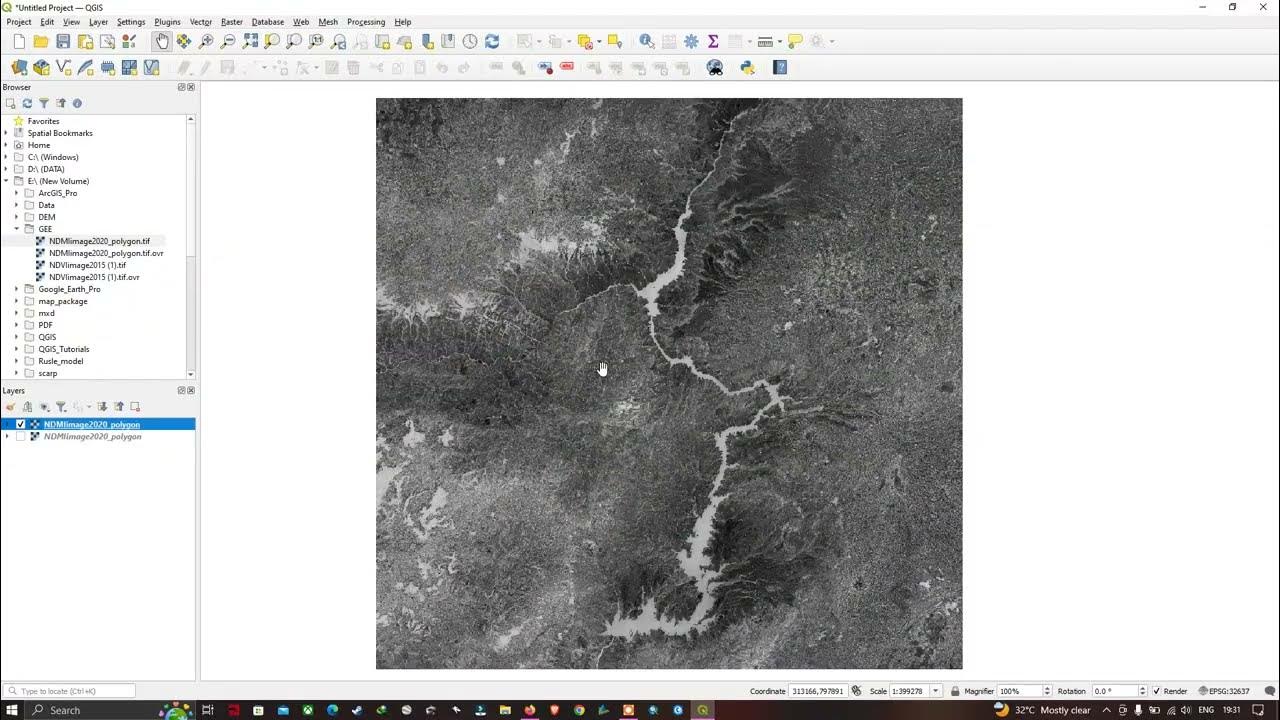
How to Import Raster layer in QGIS | QGIS 3.28 - Latest Tutorials
5.0 / 5 (0 votes)