SPtDV • Part 3: Cara Menentukan Pertidaksamaan Dua Variabel dari Grafik Daerah Penyelesaian
Summary
TLDRIn this video, the presenter explains how to determine inequalities with two variables from a given solution region on a graph. The process includes finding linear or quadratic equations from the graph, identifying whether the inequality is strict or non-strict, and testing points to determine the inequality sign. Additionally, the video demonstrates two methods for deriving linear equations from graphs, including a faster approach using the x- and y-intercepts. The speaker also explains how to find quadratic equations from a graph based on different known points or the vertex. The tutorial is aimed at helping viewers understand these concepts for solving inequality problems.
Takeaways
- 😀 The video explains how to determine inequalities from solution regions of two-variable inequalities.
- 😀 Step 1: Identify whether the function is linear or quadratic by looking at the graph (straight line or parabola).
- 😀 To differentiate between inequalities like 'greater than' or 'less than', check if the graph is a solid or dashed line.
- 😀 Solid lines in graphs indicate inequalities with 'equal to' (e.g., ≤, ≥), while dashed lines represent inequalities without 'equal to' (e.g., <, >).
- 😀 The first step in determining an inequality from a solution region is to find the equation of the linear or quadratic function from the given graph.
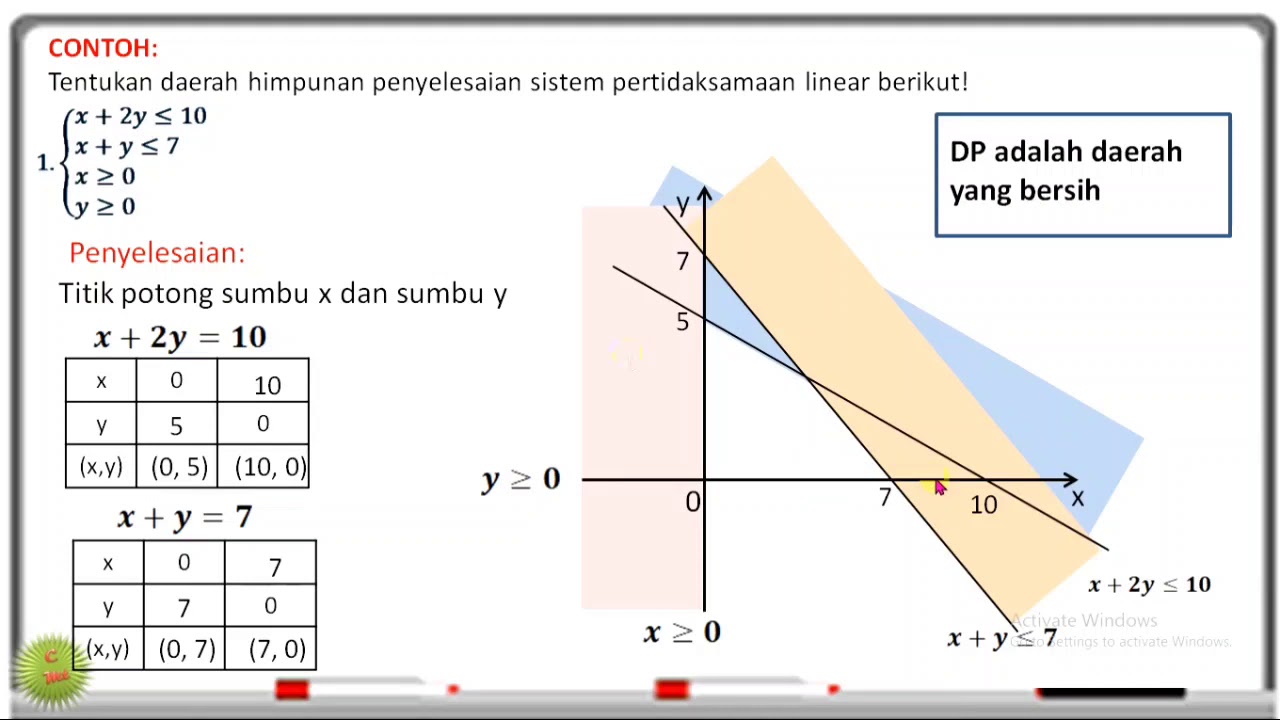
- 😀 For linear functions, the equation can be determined using known points on the line, either with general formulas or a quicker method if the x- and y-intercepts are given.
- 😀 The formula for linear equations can be derived from the points where the graph intersects the x-axis and y-axis.
- 😀 A quicker method for linear equations involves using the x- and y-intercept values directly to form the equation y = mx + b.
- 😀 When determining the equation of a quadratic function from a graph, use either the x-intercepts or the vertex form, depending on what information is available.
- 😀 If three points are known for a quadratic function, substitute the points into the general quadratic equation y = ax² + bx + c to solve for the constants a, b, and c.
Q & A
What is the main objective of the video?
-The main objective of the video is to explain how to determine inequalities with two variables from a given solution region or graph, as well as to discuss how to derive linear or quadratic equations from such graphs.
What is the first step in determining an inequality from a solution region?
-The first step is to determine the equation of a linear or quadratic function based on the points shown in the graph.
How do you distinguish between a linear function and a quadratic function from the graph?
-A linear function will appear as a straight line, while a quadratic function will form a parabola on the graph.
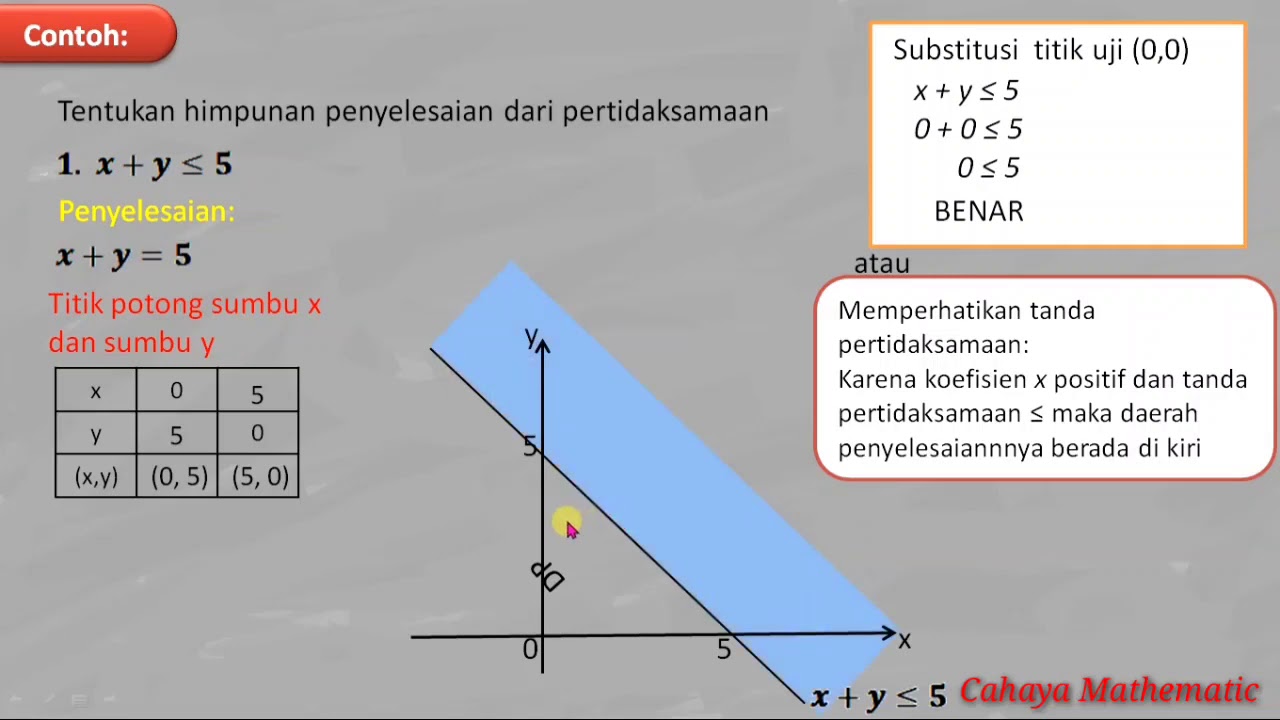
What is the purpose of the point test mentioned in the video?
-The point test is used to check whether a given point in the solution region satisfies the inequality, helping to determine the correct inequality sign (greater than, less than, or equal to).
How do you handle inequalities when the graph has a solid line?
-When the graph has a solid line (either linear or quadratic), the inequality includes an 'equal to' condition (e.g., ≤ or ≥).
How does the inequality change when the graph has a dashed line?
-If the graph has a dashed line, the inequality does not include the 'equal to' condition (e.g., < or >).
What are the two methods for determining the equation of a linear function from a graph?
-The two methods are: 1) Using two known points on the line to find the equation using the slope formula. 2) Using the x-intercept and y-intercept points to directly find the equation.
What is the advantage of using the intercept method to find a linear equation?
-The advantage of using the intercept method is that it is faster, but it only works if the graph clearly shows the x- and y-intercepts.
How do you determine a quadratic equation from a graph?
-To determine a quadratic equation, you can use three methods: 1) If you know the x-intercepts, the equation is written in factored form. 2) If you know the vertex, the equation is written using the vertex form. 3) If you know three points, you can substitute them into the general quadratic equation and solve for the coefficients.
What method is used to solve for the coefficients when three points are known for a quadratic function?
-The method used is solving a system of linear equations with three variables (a, b, and c) through techniques like substitution or elimination to determine the coefficients of the quadratic equation.
Outlines

此内容仅限付费用户访问。 请升级后访问。
立即升级Mindmap

此内容仅限付费用户访问。 请升级后访问。
立即升级Keywords

此内容仅限付费用户访问。 请升级后访问。
立即升级Highlights

此内容仅限付费用户访问。 请升级后访问。
立即升级Transcripts

此内容仅限付费用户访问。 请升级后访问。
立即升级浏览更多相关视频
SPtDV Matematika Kelas 10 • Part 1: Pertidaksamaan Linear & Kuadrat Dua Variabel
SISTEM PERTIDAKSAMAAN LINEAR DUA VARIABEL SPtLDV
SPtDV • Part 8: Soal Menentukan Sistem Pertidaksamaan Linear Dua Variabel / SPtLDV dari Grafik (2)

Materi Sistem pertidaksamaan Linear dua Variabel (Matematika) - Bagian 1
PERTIDAKSAMAAN LINEAR DUA VARIABEL

Linear Programming - Graphical Solution | Don't Memorise
5.0 / 5 (0 votes)
