SPtDV • Part 8: Soal Menentukan Sistem Pertidaksamaan Linear Dua Variabel / SPtLDV dari Grafik (2)
Summary
TLDRIn this educational video, the presenter explains how to solve a system of linear inequalities with two variables, using a series of example problems. The focus is on determining the correct system of inequalities for a shaded solution region on a graph. The tutorial includes detailed steps on how to find inequalities, test points, and handle different types of lines, including vertical and slanted lines. The video also emphasizes understanding the relationships between the inequalities and the graph's shaded areas to identify the solution region.
Takeaways
- 😀 The video explains how to determine the system of inequalities for a two-variable linear system.
- 😀 It introduces the concept of shaded and non-shaded regions, emphasizing that the solution area is the shaded region in this case.
- 😀 The problem involves finding the inequalities based on a quadrilateral-shaped solution region.
- 😀 For each line, a method is demonstrated using two specific points to derive the inequality.
- 😀 The process of determining the inequalities involves using point-slope formulas, such as y - y1 = m(x - x1).
- 😀 The first inequality is derived by testing a point (3,3) and checking whether it lies inside the solution region.
- 😀 The second inequality involves similar steps but uses different points and results in a different inequality.
- 😀 The third inequality is also derived through a point test, verifying the solution region based on the test point.
- 😀 The fourth inequality is based on a vertical line, with logical reasoning concluding that the solution is for x ≥ 2.
- 😀 The final system of inequalities is summarized as: x + y ≤ 2, 2x + y ≤ 11, x + y ≥ -1, and x ≥ 2.
Q & A
What is the main topic of the video?
-The main topic of the video is about solving systems of linear inequalities with two variables, specifically focusing on finding the inequality system from a given shaded region on a graph.
How does the video explain the concept of a shaded region?
-The video explains that the shaded region in the graph represents the solution set of the system of inequalities. The key point is that the shaded region corresponds to the solution, while the non-shaded region does not.
What is the first step in determining the system of inequalities?
-The first step is to identify the boundary lines of the shaded region. These lines represent the constraints of the inequalities, and each line will be analyzed to find the corresponding inequality.
Why is the region outside the shaded area not the solution set?
-The region outside the shaded area is not the solution because, according to the problem's setup, the shaded area represents the valid solutions, while the non-shaded area does not satisfy the inequalities.
How are the boundary lines for the inequalities determined?
-The boundary lines are determined by finding the equations of the lines that divide the shaded and non-shaded regions. These lines are linear and represent the boundary for each inequality.
What method is used to find the equations of the boundary lines?
-The method involves using two points that the line passes through and applying the point-slope formula to derive the equation of the line. In some cases, the equation is rewritten into standard form, like Ax + By = C.
How do you verify the inequality for a specific point?
-To verify the inequality, a test point is selected from the shaded region. The coordinates of this point are substituted into the inequality, and if the inequality holds true, the inequality is correct.
What does the term 'x > 2' represent in the context of the system of inequalities?
-The term 'x > 2' represents a vertical line at x = 2, where the solution set lies to the right of this line. It means that x must be greater than 2 for the inequality to hold.
What role does the concept of 'greater than or equal to' play in the inequalities?
-'Greater than or equal to' means that the solution includes the boundary line itself, which is why the inequality has the 'equal to' part. The solution set contains points on the line as well as the region on one side of it.
What is the final system of inequalities based on the video?
-The final system of inequalities based on the video is: x + y ≤ 2, 2x + y ≤ 11, x + y ≥ -1, and x ≥ 2.
Outlines

This section is available to paid users only. Please upgrade to access this part.
Upgrade NowMindmap

This section is available to paid users only. Please upgrade to access this part.
Upgrade NowKeywords

This section is available to paid users only. Please upgrade to access this part.
Upgrade NowHighlights

This section is available to paid users only. Please upgrade to access this part.
Upgrade NowTranscripts

This section is available to paid users only. Please upgrade to access this part.
Upgrade NowBrowse More Related Video
Menyelesaikan Permasalahan Program Linear Menentukan Nilai Optimum dengan Metode Uji Titik Pojok
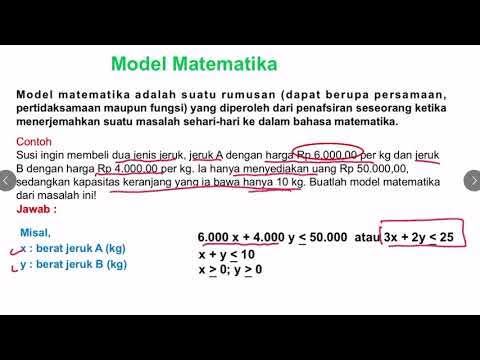
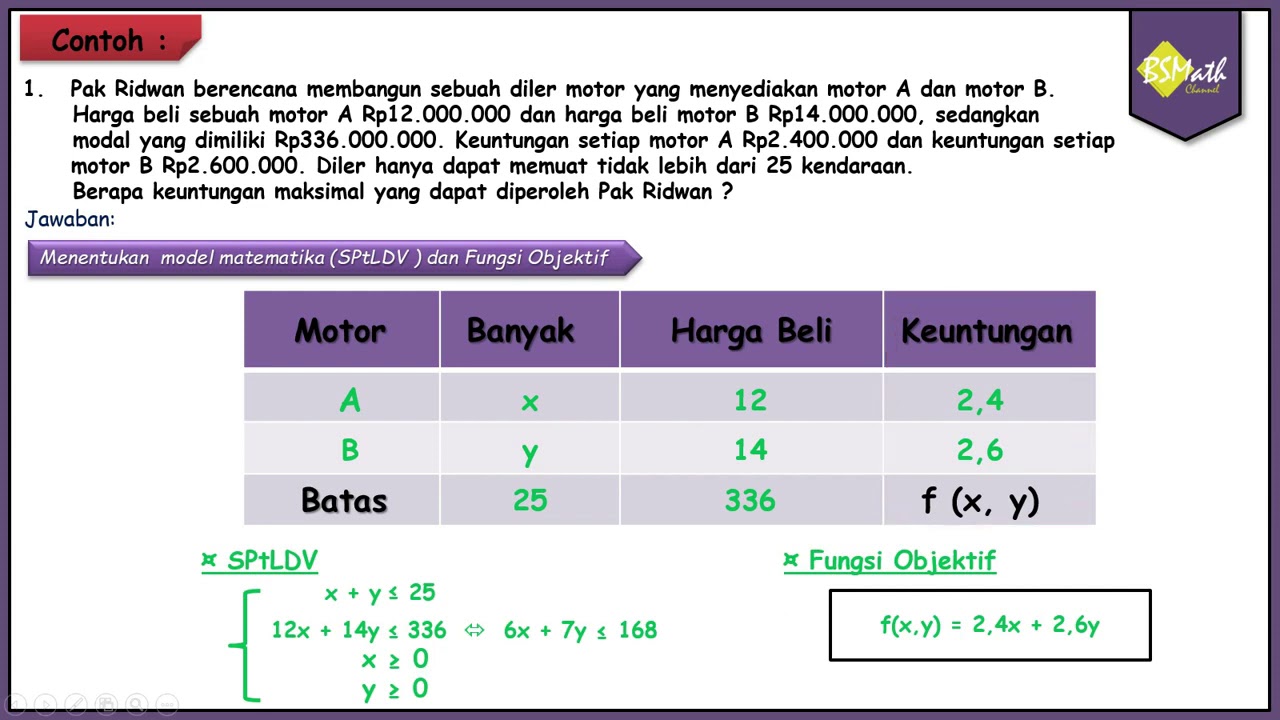
MENENTUKAN MODEL MATEMATIKA DARI SOAL CERITA SPtLDV

Linear Programming - Graphical Solution | Don't Memorise

Materi Sistem pertidaksamaan Linear dua Variabel (Matematika) - Bagian 1
SPtDV Matematika Kelas 10 • Part 1: Pertidaksamaan Linear & Kuadrat Dua Variabel
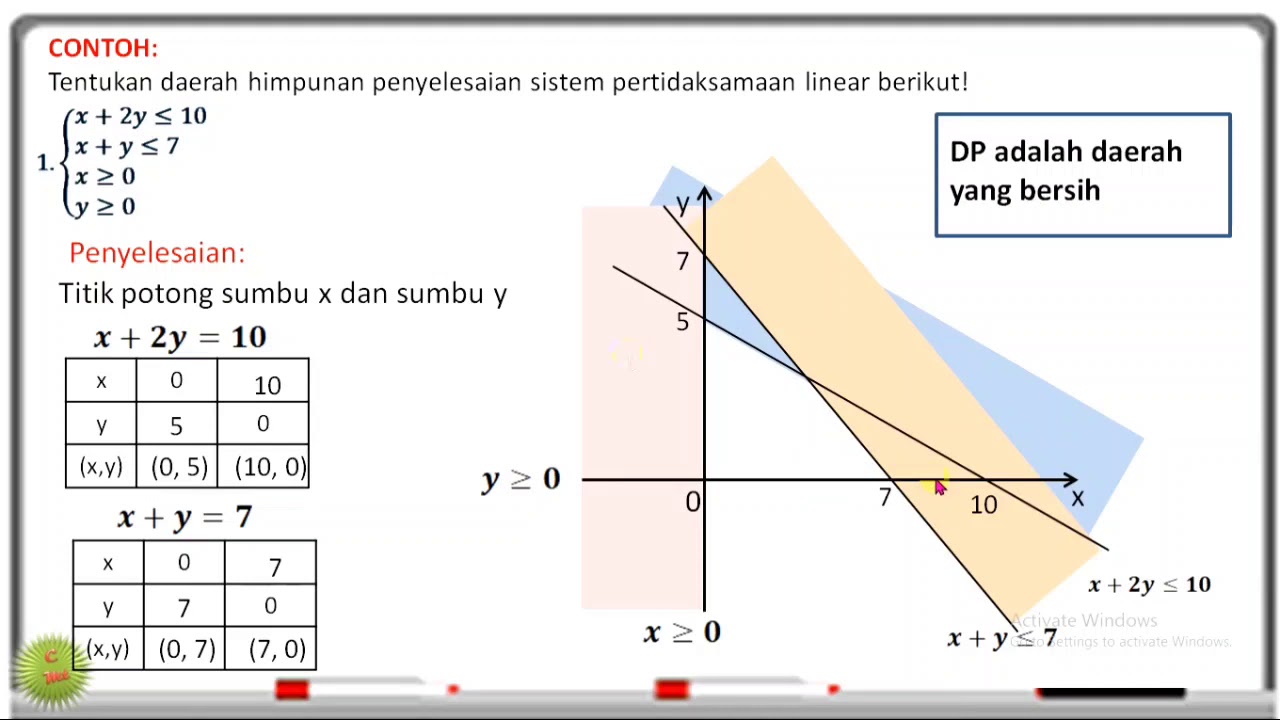
SISTEM PERTIDAKSAMAAN LINEAR DUA VARIABEL SPtLDV
5.0 / 5 (0 votes)