Introduction to Fourier Transform Infrared Spectroscopy (FTIR)

Penn State MRI
16 Dec 202106:40

Summary

TLDRIn this video, Tawanda Zimudzi introduces Fourier Transform Infrared Spectroscopy (FTIR), explaining its basis on the interaction between infrared radiation and matter. FTIR measures the frequency and intensity of absorbed infrared radiation to identify molecular bond vibrations. It offers qualitative and quantitative analysis, with applications in identifying functional groups, impurities, and polymer characterization. Advantages include speed, minimal sample prep, and non-destructive analysis, but it requires careful interpretation and calibration for quantitative results.

Takeaways

  • 🌐 **FTIR Overview**: Fourier Transform Infrared Spectroscopy (FTIR) is a technique that studies the interaction between infrared radiation and matter.
  • 🔍 **Infrared Interaction**: When IR light hits a sample, it can be reflected, transmitted, or absorbed, with the goal of measuring these to understand the frequency and intensity of absorbed IR radiation.
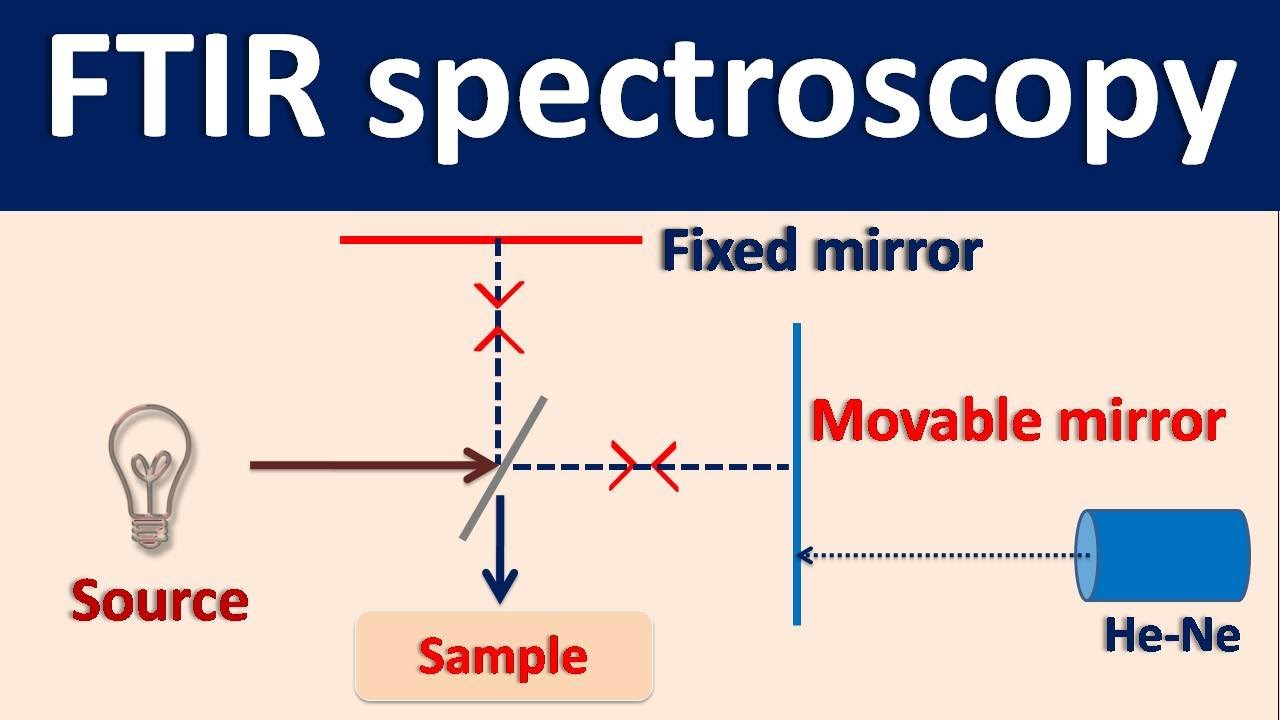
  • 🔬 **Sample Analysis**: The process involves placing a sample in the path of an IR source and measuring the reflected or transmitted beam at a detector.
  • 📊 **Data Presentation**: Historically, FTIR data is plotted with wave number on the X-axis and either transmittance or absorbance on the Y-axis, showing characteristic peaks or dips.
  • 🔑 **Qualitative Analysis**: Qualitative information is derived from the frequency of bond vibrations, influenced by bond strength and reduced mass.
  • 🔍 **Structural Information**: The 'Fingerprint Region' below 1800 inverse centimeters often provides detailed structural information, despite peak overlap complicating interpretation.
  • 📈 **Quantitative Analysis**: The Beer-Lambert Equation relates absorbance to concentration, path length, and molar absorptivity, allowing for quantitative analysis.
  • 🚀 **Advantages of FTIR**: FTIR is fast, requires minimal sample preparation, is adaptable for in-situ applications, non-destructive, and can be surface-sensitive.
  • ⚠️ **Disadvantages of FTIR**: Spectra interpretation can be complex, true quantitative analysis challenging, and it's sensitive to CO2 and water vapor.
  • 🧪 **Applications**: FTIR is used for identifying functional groups, structure elucidation, impurity determination, orientation, catalysis, process monitoring, and polymer characterization.
  • 🔬 **Instrument Capabilities**: At the MCL, they have instruments covering near-IR, mid-IR, and far-IR, with capabilities for in-situ analysis, atmosphere control, and micro-analysis.

Q & A

  • What is Fourier Transform Infrared Spectroscopy (FTIR)?

    -FTIR is a spectroscopic technique that measures the interaction between infrared radiation and matter. It involves analyzing the reflected or transmitted beam after it passes through a sample to determine the frequency and intensity of infrared radiation absorbed by the sample.

  • How does infrared radiation interact with a sample in FTIR?

    -When an infrared beam strikes a sample, it can be reflected, transmitted, or absorbed. The goal is to measure the reflected or transmitted beam to obtain information about the frequencies and intensities of the absorbed radiation.

  • What is the purpose of placing a sample in the path of an IR source?

    -Placing a sample in the path of an IR source allows the measurement of the reflected or transmitted beam at an infrared detector, which provides information about the molecular bond vibrations in the sample.

  • How does the energy absorbed by a sample relate to the transmitted beam?

    -The energy absorbed by the vibrating molecules is missing in the transmitted beam, which is then converted to an electrical signal at the detector, enabling the plotting of a graph of IR frequency versus intensity.

  • What is the significance of the wave number on the X axis in FTIR data?

    -The wave number on the X axis represents the frequency of the infrared radiation absorbed by the sample, with units of inverse centimeters.

  • What information can be obtained from the Y axis in an FTIR plot?

    -The Y axis can represent either transmittance or absorbance. Transmittance shows dips where the sample absorbs IR radiation, while absorbance shows peaks where the IR light is absorbed.

  • How does qualitative analysis in FTIR work?

    -Qualitative analysis is based on the frequency at which bond vibrations occur, which depends on bond strength and reduced mass. This allows for the identification of different types of chemical bonds and the distinction between different species bonded to carbon.

  • What is the Fingerprint Region in FTIR and why is it important?

    -The Fingerprint Region is the area below 1,800 inverse centimeters in an FTIR plot. It contains structural information that is often unique to a compound, making it useful for compound identification and structure elucidation.

  • How does the Beer-Lambert Equation relate to quantitative analysis in FTIR?

    -The Beer-Lambert Equation states that the absorbance of IR light is proportional to the concentration of the absorbing species in the sample, the path length of the sample, and the molar absorptivity. This relationship allows for the determination of pseudo-quantitative information by comparing peak areas or absorbance values.

  • What are some advantages of using FTIR?

    -FTIR is fast, requires little to no sample preparation, is adaptable for in-situ applications, non-destructive, and can be extremely surface-sensitive.

  • What are the disadvantages of FTIR as mentioned in the script?

    -The disadvantages of FTIR include the time-consuming nature of spectrum interpretation, difficulty in true quantitative analysis, sensitivity to carbon dioxide and water vapor, and the lack of elemental information.

  • What are some typical applications of FTIR?

    -Typical applications of FTIR include identification of functional groups, structure elucidation, determination of impurities, orientation, catalysis, process monitoring, and polymer characterization.

Outlines

00:00

🔬 Introduction to Fourier Transform Infrared Spectroscopy (FTIR)

Tawanda Zimudzi introduces FTIR, explaining the interaction between infrared radiation and matter. The process involves an infrared beam striking a sample, leading to reflection, transmission, or absorption. The experiment's goal is to measure the reflected or transmitted beam to determine the frequency and intensity of absorbed infrared radiation. This is achieved by placing the sample in the path of an IR source, typically a heated silicon carbide rod, and measuring the beam at an infrared detector. When IR radiation passes through the sample, certain energies are absorbed, corresponding to molecular bond vibrations. This absorption is reflected in the detector's electrical signal, allowing for a graph of IR frequency versus intensity to be plotted. Historically, FTIR data is presented with wave number on the X-axis and transmittance or absorbance on the Y-axis. Qualitative analysis is based on peak positions, shapes, and ratios, which depend on bond strength and reduced mass. Quantitative analysis relies on the Beer-Lambert Equation, which relates absorbance to concentration, path length, and molar absorptivity. The process also involves comparing peak areas or absorbance values for pseudo-quantitative information and constructing calibration curves for true quantitative analysis.

05:03

🌟 Advantages and Applications of FTIR

FTIR offers several advantages, including speed, minimal sample preparation, adaptability for in-situ applications, non-destructiveness, and surface sensitivity. However, it has its drawbacks, such as time-consuming spectral interpretation, difficulty in true quantitative analysis, sensitivity to carbon dioxide and water vapor, and lack of elemental information. Typical applications of FTIR encompass the identification of functional groups, structure elucidation, impurity determination, orientation determination, catalysis, process monitoring, and polymer characterization. The MCL boasts three instruments that cover near-IR, mid-IR, and far-IR, along with in-situ capabilities for temperature control and atmosphere management, and micro-analysis capabilities for sample mapping using a focal plane array detector.

Mindmap

Keywords

💡Fourier Transform Infrared Spectroscopy (FTIR)

FTIR is a technique used to obtain an infrared spectrum of absorption or emission of a solid, liquid, or gas. It is central to the video's theme as it is the main subject being discussed. The video describes how FTIR works, its applications, and its advantages and disadvantages. For example, it is explained that when an infrared beam strikes a sample, it can be reflected, transmitted, or absorbed, and the goal is to measure these interactions to obtain information about the sample.

💡Infrared Radiation

Infrared radiation is a type of electromagnetic radiation with wavelengths longer than visible light but shorter than radio waves. In the context of the video, infrared radiation is used to interact with matter, causing certain frequencies to be absorbed, which corresponds to the molecular bond vibrations in the sample. This is crucial for understanding how FTIR can be used to analyze samples.

💡Absorption

Absorption, in the context of FTIR, refers to the process where the energy of the infrared light is taken up by the molecules in the sample, causing them to vibrate. The video explains that the energies absorbed correspond to the frequency of molecular bond vibrations, which is key to understanding the chemical composition of the sample.

💡Molecular Bond Vibrations

Molecular bond vibrations are the oscillations that occur in the bonds between atoms within a molecule. The video uses this concept to explain how the absorbed energy from infrared radiation can be used to identify different types of chemical bonds within a sample, as different bonds vibrate at different frequencies.

💡Qualitative Analysis

Qualitative analysis in FTIR involves identifying the types of molecules present in a sample based on the frequencies at which they absorb infrared radiation. The video mentions that the frequency of bond vibrations depends on bond strength and reduced mass, allowing for the distinction between different types of molecules, such as alkanes, alkenes, and alkynes.

💡Quantitative Analysis

Quantitative analysis uses the Beer-Lambert Law to determine the concentration of a specific component in a sample. The video explains that by measuring the absorbance of infrared light, one can determine the concentration of the analyte, provided the path length of the sample and the molar absorptivity are known.

💡Beer-Lambert Law

The Beer-Lambert Law relates the absorbance of light to the concentration of the absorbing species in a sample. It is mentioned in the video as the basis for quantitative analysis in FTIR, stating that absorbance is proportional to the concentration of the sample, the path length, and the molar absorptivity.

💡Wave Number

Wave number is a unit used in spectroscopy to describe the frequency of a wave. In the video, wave number is used on the X-axis of an FTIR plot, with units of inverse centimeters, to represent the frequency of infrared radiation.

💡Transmittance

Transmittance refers to the percentage of light that passes through a sample. In the video, it is mentioned that when the Y-axis of an FTIR plot is in transmittance units, dips in the graph indicate where the sample absorbs infrared radiation.

💡Absorbance

Absorbance is a measure of how much light is absorbed by a sample and is directly related to the concentration of the absorbing species. The video explains that when the Y-axis of an FTIR plot is in absorbance units, peaks indicate where the infrared light is absorbed.

💡Fingerprint Region

The Fingerprint Region in an FTIR spectrum refers to the complex pattern of peaks below 1,800 inverse centimeters, which is unique to each molecule and can be used for structural identification. The video mentions that this region is often used for identifying unknown compounds due to the complexity and specificity of the peak patterns.

Highlights

Introduction to Fourier Transform Infrared Spectroscopy (FTIR).

Infrared Spectroscopy is based on the interaction between infrared radiation and matter.

Three possible outcomes when an infrared beam strikes a sample: reflected, transmitted, or absorbed.

The goal of an infrared experiment is to measure the frequency and intensity of infrared radiation absorbed by the sample.

Practical setup involves placing the sample in the path of an IR source and measuring the reflected or transmitted beam at a detector.

Absorbed energies correspond to the frequency of molecular bond vibrations in the sample.

FTIR data is historically presented with wave number on the X axis and transmittance or absorbance on the Y axis.

Qualitative analysis is based on peak position, shape, and ratios.

Bond strength and reduced mass are key factors influencing the frequency of bond vibrations.

Cyclohexanol serves as an example with a characteristic broad OH peak and two sharp C-H stretches.

The Fingerprint Region below 1,800 inverse centimeters contains structural information.

Overlap of peaks is common in FTIR, complicating data interpretation.

Quantitative analysis relies on the Beer-Lambert Equation, relating absorbance to concentration, path length, and molar absorptivity.

Pseudo-quantitative information can be obtained by comparing peak areas or absorbance values.

True quantitative analysis requires constructing a calibration curve using standards with precisely known concentrations.

FTIR is fast, requires little to no sample prep, and is adaptable for in-situ applications.

FTIR is non-destructive and can be extremely surface-sensitive.

Disadvantages include time-consuming spectrum interpretation and difficulty in true quantitative analysis.

FTIR is sensitive to carbon dioxide and water vapor, impacting experimental design.

FTIR does not provide elemental information.

Typical applications of FTIR include identification of functional groups, structure elucidation, impurity determination, and polymer characterization.

The MCL has three instruments covering near-IR, mid-IR, and far-IR, with in-situ capabilities and micro-analysis capabilities.

Transcripts

play00:01

Hello, my name is Tawanda Zimudzi and I'm going to give a

play00:06

brief introduction to Fourier Transform Infrared

play00:09

Spectroscopy. Sometimes simply referred to as FTIR.

play00:14

Infrared Spectroscopy is based on the interaction between

play00:17

infrared radiation and matter. The simplistic way of describing

play00:20

this, is that when an infrared beam strikes a sample, one of

play00:24

three things could happen: 

play00:26

The beam could be reflected, it could be transmitted, or

play00:29

it could be absorbed.

play00:32

And the goal of an infrared experiment is to measure the

play00:36

reflected or transmitted beam in order to obtain the frequency

play00:39

and intensity of infrared radiation absorbed by the

play00:41

sample. In practical terms, this means placing the sample in the

play00:46

path of an IR source, which is typically a heated silicon

play00:49

carbide rod. And measuring the reflected or transmitted beam at

play00:54

an infrared detector.

play00:56

When IR radiation passes through the sample, some energies of

play01:00

that light absorbed and the energies absorbed correspond to

play01:04

the frequency of molecular bond vibrations in the sample.

play01:09

This energy absorbed by the vibrating molecules, therefore

play01:12

missing in the transmitted beam, which is converted to electrical

play01:15

signal at the detector, allowing us to plot a graph of IR

play01:20

frequency versus intensity.

play01:22

Historically, in FTIR data is presented as a plot with wave

play01:26

number on the X axis with units of inverse centimeters.

play01:31

The Y axis could be transmittance, in which case,

play01:35

we see dips, where the sample absorbs IR radiation.

play01:40

The Y axis could also be an absorbance units, in

play01:43

which case, we see peaks.

play01:46

where the IR light is absorbed.

play01:49

Whether the Y axis is in transmitting so absorbance

play01:53

units, is purely matter of personal preference.

play01:57

You can get both qualitative and quantitative information from

play02:01

FTIR.  In terms of qualitative analysis, the frequency at which

play02:05

the bond vibrates, which is what gives us those peak positions,

play02:09

depends on a couple of factors.

play02:12

The first factor being the bond strength.  As a bond

play02:15

strength increases, the frequency at which we see a

play02:19

peak, also increases. So this allows us to tell the

play02:22

difference between an alkane, and an alkene,

play02:26

and an alkyne, for example.

play02:28

The second factor is the reduced mass, which is an average of the

play02:33

atomic masses of the bonded

play02:34

atoms. The higher the reduced mass, the lower the frequency in

play02:39

which we observe a peak, and this allows us to distinguish between

play02:43

different species bonded to carbon, for example. So we see a

play02:47

lower frequency for heavier atoms bonded to carbon and a

play02:50

higher frequency  for lighter atoms bonded to carbon.

play02:55

Qualitative analysis is done on the basis of peak position, peak

play02:59

shape and peak ratios.

play03:02

In the case of cyclohexanol, we see a characteristic broad

play03:08

OH peak, centered around 3,400 inverse centimeters. We also see two

play03:14

sharp C-H stretches, centered around 2,800 inverse centimeters.

play03:19

Most of the structural information that is contained below

play03:22

1,800 inverse centimeters in this region, is often referred to as the

play03:26

Fingerprint Region. Overlap of peaks is common in FTIR,

play03:31

which, does somewhat complicate data interpretation. However,

play03:34

there are spectral databases out there

play03:37

that can help identify unknowns.

play03:42

Quantitative analysis is on the basis of relationship known as a

play03:46

Beer-Lambert Equation.

play03:48

As IR-light passes through a sample

play03:52

and is absorbed, the absorbance is

play03:54

proportional to the concentration of

play03:55

absorbance in the sample; 

play03:58

the path length or thickness of the sample;

play04:00

and a property that is unique to each sample,

play04:05

known as the Molar Objectivity.

play04:08

In practical terms, what this means is that, when the sample

play04:12

thickness is constant, the absorbance, is directly 

play04:15

proportional to the

play04:16

concentration. And as a result, obtaining 

play04:20

pseudo-quantitative information is relatively straightforward.

play04:25

And this is accomplished by directly comparing peak areas

play04:29

or absorbance values. So in this example here, the relative

play04:33

analyte concentration was determined by integrating the

play04:37

area of the peak.  And smaller peak area, corresponds to low

play04:42

concentration. While a higher peak area corresponds to

play04:46

higher concentration.

play04:49

For truly quantitative information where physically

play04:52

meaningful concentration units are required, a calibration

play04:55

curve must be constructed using standards where the

play04:59

concentration of those standards is precisely known. 

play05:03

And once we have a calibration curve, it is possible to

play05:07

calculate the concentration of the unknown, by interpolation

play05:09

into that calibration curve.

play05:14

FTIR has several advantages.  It is relatively

play05:17

fast; analysis takes an order of minutes. There is little to

play05:21

no sample prep required.

play05:23

It's easy to adapt for in-situ applications, it is non-destructive and

play05:28

can be extremely surface-sensitive.

play05:29

The disadvantages of FTIR is that interpretation of

play05:34

spectra can be time consuming.  True quantitative analysis

play05:38

can be difficult.

play05:40

And FTIR extremely sensitive to carbon dioxide and water

play05:43

vapor, which means we have to take that into consideration

play05:47

when designing an experiment.

play05:49

FTIR also does not give any elemental information.

play05:53

Typical applications of FTIR include identification of

play05:57

functional groups and structure elucidation;

play06:00

determination of impurities; 

play06:03

determination of orientation; catalysis; process monitoring

play06:07

and polymer characterization.

play06:10

Here at the MCL, we have three instruments, which combined, can

play06:14

cover near-IR, mid-IR and far-IR.  We also have in-situ

play06:19

capabilities, which allows us to heat and cool samples; control

play06:23

the atmosphere in which we run our samples. We also have 

play06:28

micro-analysis capabilities which allow us to map samples using a

play06:32

focal plain array detector.

Rate This

5.0 / 5 (0 votes)

相关标签
FTIR SpectroscopyInfrared AnalysisChemical IdentificationMolecular VibrationsQualitative AnalysisQuantitative AnalysisSpectral DatabasesNon-Destructive TestingSurface SensitivityMaterial Characterization
您是否需要英文摘要?