Lec 46 - Exponential Functions: Graphing
Summary
TLDRThis educational video script explores the properties of exponential functions, particularly focusing on functions of the form f(x) = a^x. It discusses the domain, range, intercepts, and end behavior of these functions, highlighting that for a > 1, the function is always increasing with no x-intercept, and for 0 < a < 1, it is decreasing. The script also emphasizes the importance of understanding the graphical behavior of exponential functions without relying solely on visual aids, and concludes with a summary table differentiating the characteristics of exponential functions based on the value of 'a'.
Takeaways
- 📚 The script discusses the properties of exponential functions, specifically focusing on functions of the form f(x) = a^x.
- 🔍 When 'a' is greater than 1, the domain of the function is the entire real line, and the range is from 0 to infinity.
- 📈 For a > 1, the function is always increasing and never touches the x-axis, meaning there is no x-intercept.
- 📉 When 0 < a < 1, the function is decreasing, and the end behavior is that as x approaches infinity, f(x) approaches 0, and as x approaches negative infinity, f(x) approaches infinity.
- 📍 The y-intercept for both cases (a > 1 and 0 < a < 1) is (0, 1), as a^0 equals 1 for any a.
- 🚫 There are no roots for exponential functions where a > 0, as the function never crosses or touches the x-axis.
- 💡 The horizontal asymptote for all such exponential functions is y = 0, indicating the behavior as x approaches infinity or negative infinity.
- 📊 The script introduces the concept of graphing exponential functions without the need for a graphing tool by understanding their properties.
- 🤓 The behavior of the function changes based on the value of 'a', and understanding this allows for predicting the shape and behavior of the graph.
- 🔑 The script uses specific examples, such as f(x) = 2^x and g(x) = 5^(-x), to illustrate the general properties of exponential functions.
- 📈📉 The reflection of the graph across the y-axis (by replacing x with -x) results in a change from an increasing to a decreasing function and vice versa.
Q & A
What is the domain of the function f(x) = 2^x?
-The domain of the function f(x) = 2^x is the entire real line, as it is defined for all real values of x.
What is the range of the function f(x) = 2^x?
-The range of the function f(x) = 2^x is from 0 to infinity (0 to ∞), since 2^x is always positive and never reaches 0.
Does the function f(x) = 2^x have any x-intercepts?
-No, the function f(x) = 2^x does not have any x-intercepts because it never touches the x-axis, as it is always greater than 0.
What is the y-intercept of the function f(x) = 2^x?
-The y-intercept of the function f(x) = 2^x is at the point (0, 1), which occurs when x = 0.
What is the end behavior of the function f(x) = 2^x as x approaches infinity?
-As x approaches infinity, the function f(x) = 2^x also tends to infinity because the exponential growth rate is faster than linear growth.
What is the end behavior of the function f(x) = 2^x as x approaches negative infinity?
-As x approaches negative infinity, the function f(x) = 2^x approaches 0, but never actually reaches it, due to the horizontal asymptote at y = 0.
Are there any roots for the function f(x) = 2^x?
-No, there are no roots for the function f(x) = 2^x because it never crosses or touches the x-axis.
Is the function f(x) = 2^x increasing or decreasing throughout its domain?
-The function f(x) = 2^x is increasing throughout its domain because for any x1 < x2, 2^x1 < 2^x2.
What happens when the base 'a' of the exponential function f(x) = a^x is greater than 1?
-When the base 'a' is greater than 1, the function f(x) = a^x has similar properties to f(x) = 2^x: it is increasing, has no x-intercepts, and has a horizontal asymptote at y = 0.
What is the effect on the graph of the function when x is replaced with -x in an exponential function?
-Replacing x with -x in an exponential function reflects the graph across the y-axis, changing the increasing function to a decreasing one and vice versa.
What is the general behavior of the graph of f(x) = a^x when 0 < a < 1?
-When 0 < a < 1, the graph of f(x) = a^x is a decreasing function with the same domain and range as when a > 1, but with a horizontal asymptote at y = 0 and tending to infinity as x approaches negative infinity.
Outlines

This section is available to paid users only. Please upgrade to access this part.
Upgrade NowMindmap

This section is available to paid users only. Please upgrade to access this part.
Upgrade NowKeywords

This section is available to paid users only. Please upgrade to access this part.
Upgrade NowHighlights

This section is available to paid users only. Please upgrade to access this part.
Upgrade NowTranscripts

This section is available to paid users only. Please upgrade to access this part.
Upgrade NowBrowse More Related Video

Lec 52 - Logarithmic Functions
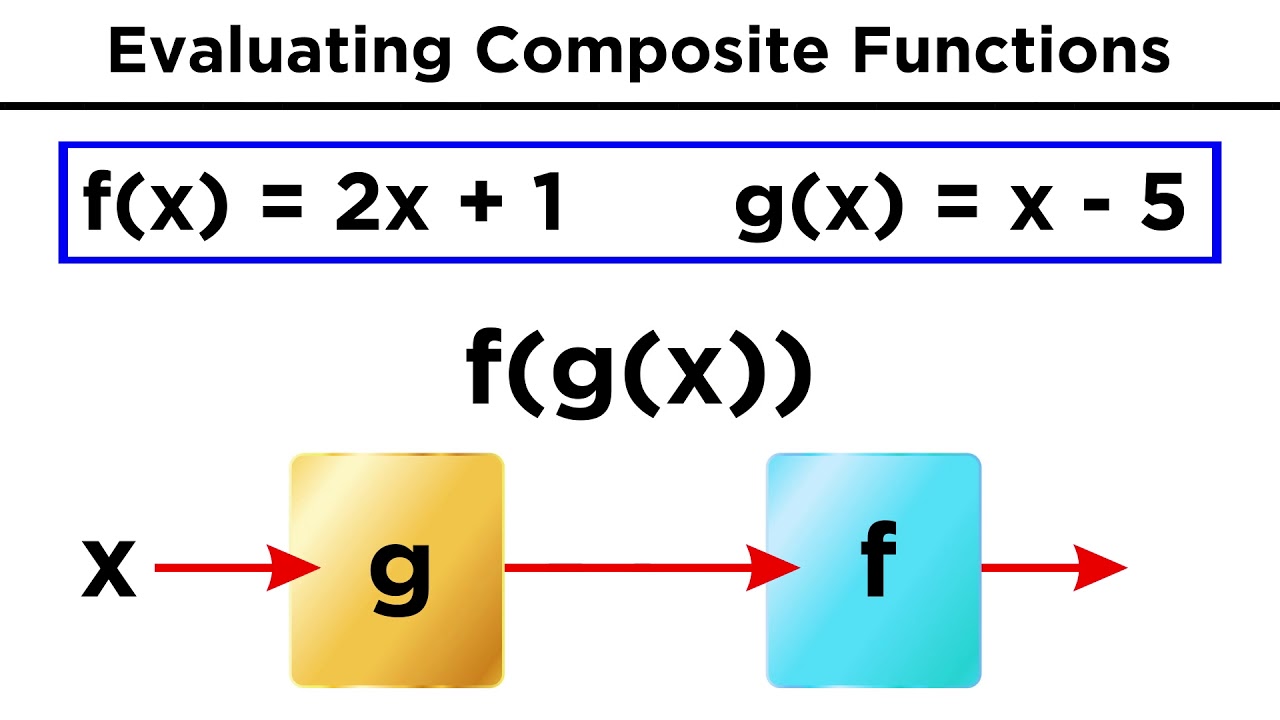
Manipulating Functions Algebraically and Evaluating Composite Functions
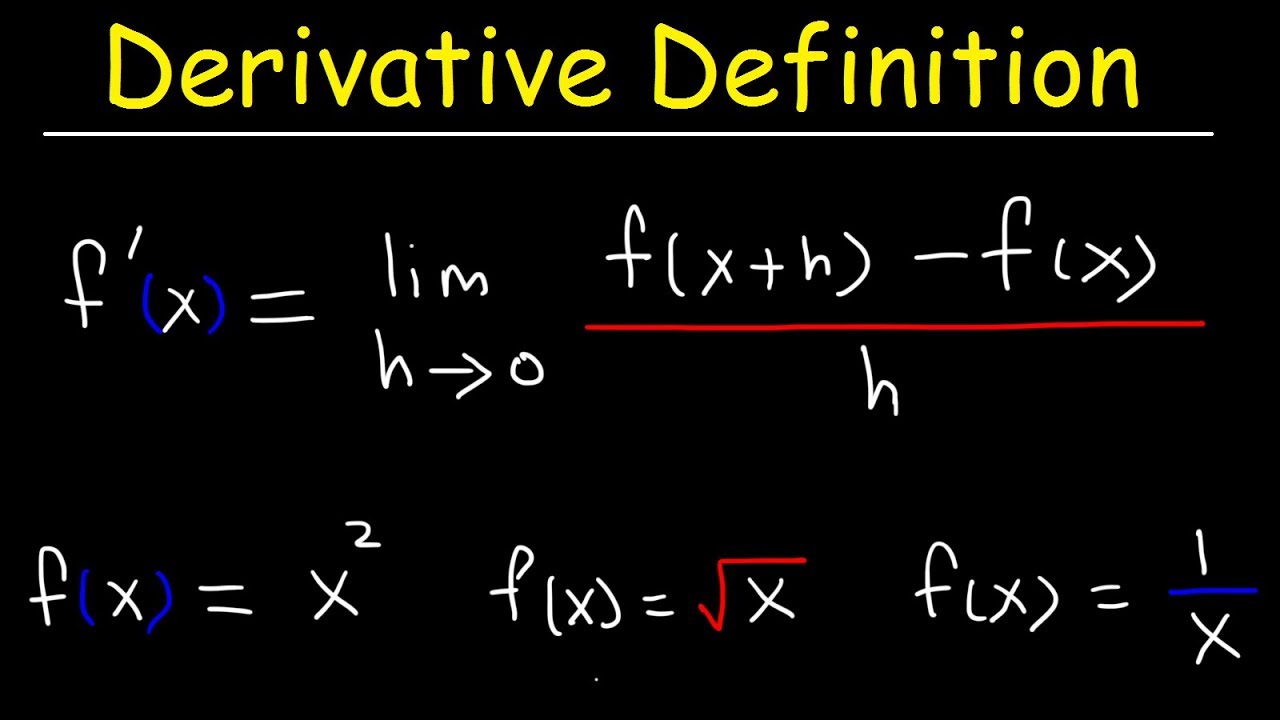
Definition of the Derivative
Verifying inverse functions by composition | Mathematics III | High School Math | Khan Academy
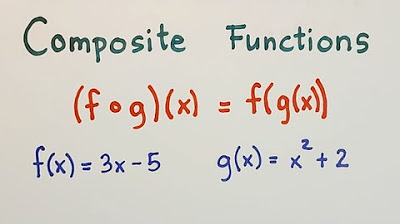
Composition of Functions - Grade 11 - General Mathematics

Inverse of One-to-One Function | Grade 11- General Mathematics
5.0 / 5 (0 votes)