TESLA Stock - Watch For These Crucial Levels
Summary
TLDRIn this Tesla stock update, the analyst discusses recent market movements, focusing on Tesla's performance and potential volatility. Key technical levels are highlighted, including support and resistance zones around $314-315 and $330-333. The video emphasizes the importance of monitoring key indicators like the MACD, Fibonacci levels, and the SMI for bullish or bearish signals. Attention is given to external events, like Jackson Hole, which could impact market sentiment in the short term. Options flow is also mentioned, indicating mixed sentiment. The overall outlook depends on how Tesla behaves relative to these crucial price points.
Takeaways
- 😀 Tesla closed the day down by 1.17%, reaching around $320 per share, which is near the 50-exponential moving average.
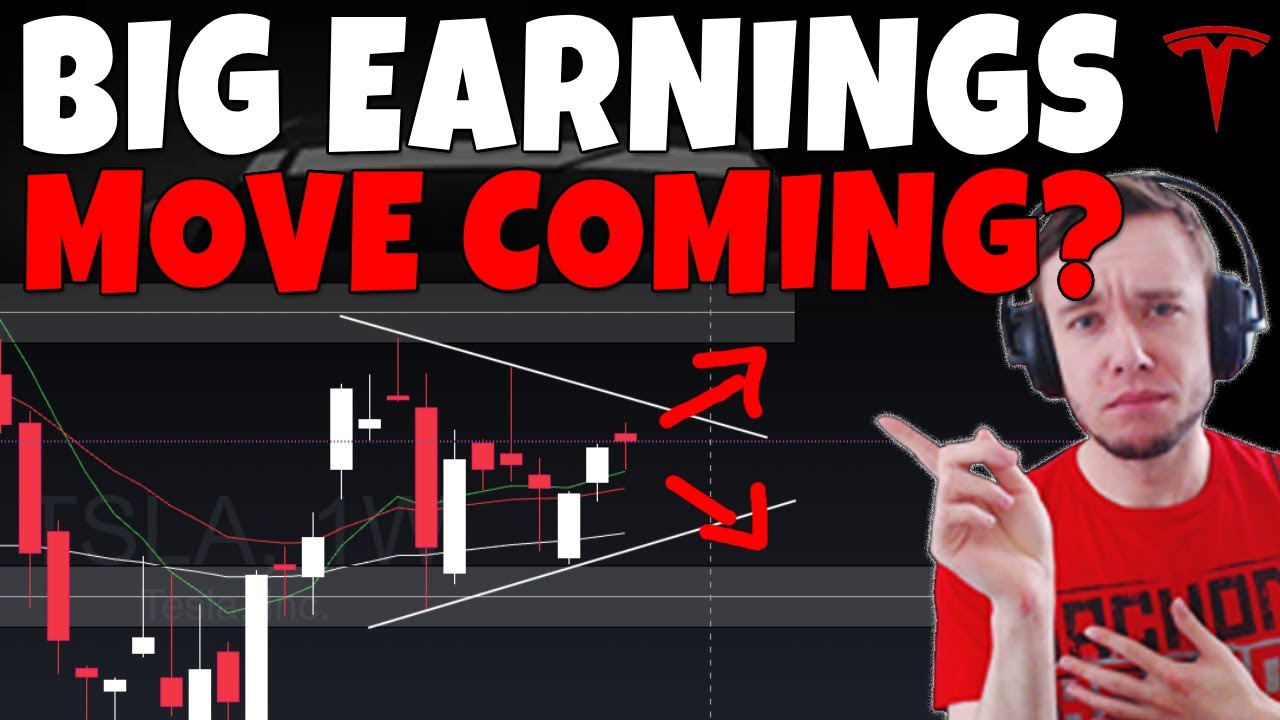
- 📉 The daily pennant chart is a bit messy, but the weekly pennant is showing clearer signals. A move either above or below the pennant could lead to a substantial move in the stock.
- 📅 Jackson Hole event is happening tomorrow, historically followed by market volatility in the 5 days after the speech. Worth keeping an eye on potential market shifts.
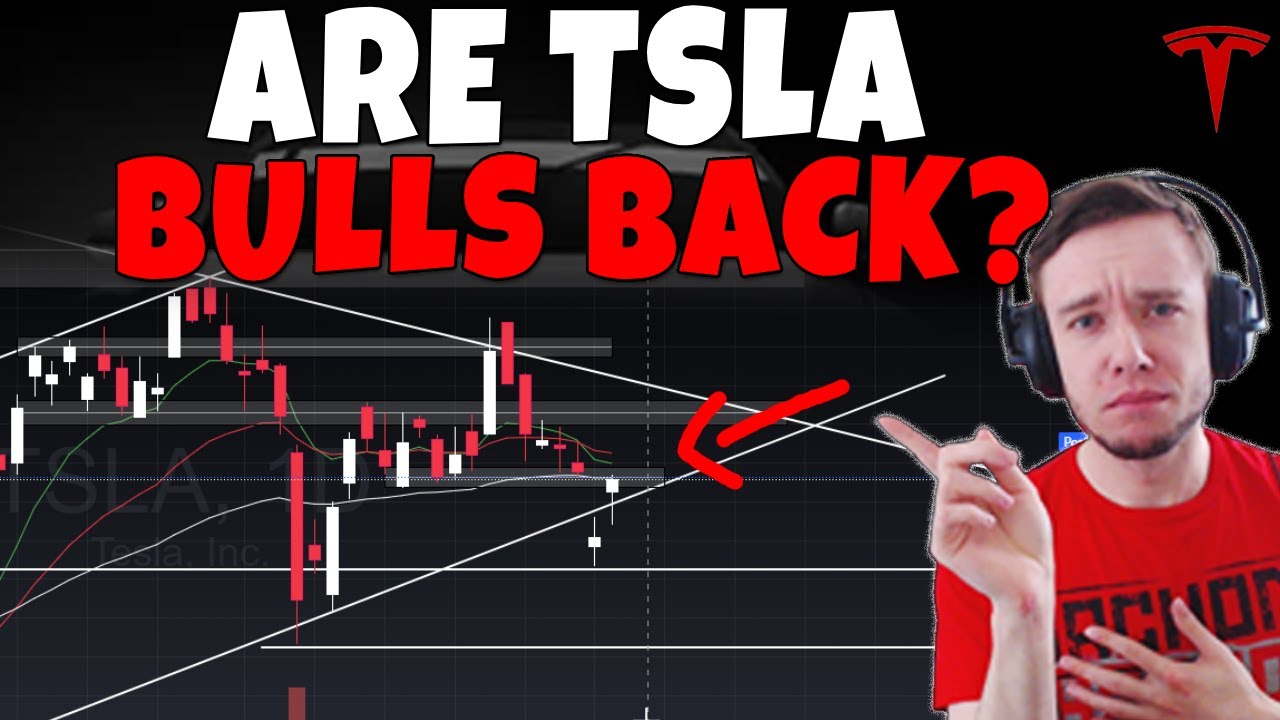
- 🛑 The key support level for Tesla is around $314-$315. If Tesla closes below this level, it could shift to resistance and signal potential bearish movement.
- 🔝 The primary resistance for Tesla is at $330-$333. A break above this would provide a strong bullish confirmation.
- ⚡ The MACD indicator is still not confirming a bullish crossover, with multiple failed attempts to push bullish.
- 📊 The 4-hour SMI is showing a potential bottoming-out, suggesting a small reversal or stabilization might be possible if it holds at current levels.
- 💹 Historical data indicates that Jackson Hole events tend to lead to a flat or slightly negative market reaction initially, with bigger moves often happening five days after.
- 💰 There’s mixed options flow with some large bets placed on both bullish and bearish sides for Tesla, including **$307.5 puts** expiring next week and **$320-$322.5 calls** expiring tomorrow.
- 📈 Tesla’s price action is at a critical juncture. Holding above $315 keeps the bullish case alive, but breaking below would indicate a potential bearish trend.
- 🧠 A breakout above $330-$333 could be a strong bullish signal, confirming that Tesla is heading higher after holding up despite recent market fluctuations.
Q & A
What is the main focus of the Tesla stock analysis in the video?
-The main focus is on analyzing Tesla stock's recent performance, particularly its movement in relation to key technical levels like moving averages and Fibonacci retracements. The video also discusses the broader market context and potential volatility due to upcoming events like Jackson Hole.
What is the significance of the 314-315 price range for Tesla stock?
-The 314-315 price range is a critical support zone for Tesla stock. If the stock closes below this range, it could signal a bearish trend, turning this level into resistance and leading to further downside. Holding above this range would maintain a bullish outlook.
Why does the analyst prefer the weekly pennant over the daily pennant for analysis?
-The analyst prefers the weekly pennant because the daily pennant has been showing false breakouts and less clarity. The weekly pennant is tighter and more reliable, with a larger potential for significant movement once the price breaks above or below it.
How does the MACD indicator impact the analysis of Tesla stock?
-The MACD is currently not showing a bullish crossover, indicating that Tesla stock has been struggling to maintain upward momentum. Each attempt at a bullish crossover has been rejected, which suggests that the stock may face resistance before any significant upward movement.
What role does the Jackson Hole event play in the market outlook?
-The Jackson Hole event, where Jerome Powell speaks, is historically linked to market volatility. Based on past events, the market tends to experience flat or slightly positive movement before the speech, followed by significant volatility in the days after. The analyst expects this pattern to possibly repeat this time.
What Fibonacci levels are important for Tesla's price movement?
-The key Fibonacci level for Tesla's price movement is around the 317 range, where the stock encountered resistance. This level aligns with the 62% Fibonacci retracement and acts as a critical point for the bulls to hold in order to maintain a bullish outlook.
What does the analyst mean by 'bullish retracement' in Tesla's price action?
-A bullish retracement refers to a temporary pullback in Tesla's price within an overall uptrend. The analyst sees the current price action as a potential retracement to the Fibonacci levels, after which the stock may continue to rally higher if it can reclaim certain resistance levels.
What is the significance of the 330-333 resistance zone for Tesla?
-The 330-333 resistance zone is a key level where the bulls need to break through for stronger bullish confirmation. A close above this range would signal that the bulls are in control and that Tesla may continue its upward trajectory.
What impact do the options flows have on the stock's outlook?
-The options flow shows a mix of bullish and bearish activity, with a slight lean toward bearish. Some traders are betting on short-term downside (with 307.5 puts expiring next week), while others are betting on a positive reaction to the Jackson Hole event. The options flow suggests mixed sentiment, but the short-term nature of the trades means they may not have a long-term impact.
What does the analyst believe could happen if Tesla falls below the 314-315 level?
-If Tesla falls below the 314-315 level and closes below it, the analyst believes that the stock could turn bearish, with the 314-315 level acting as resistance. This could lead to further downside, potentially breaking out of the current pennant pattern and signaling a larger decline.
Outlines

This section is available to paid users only. Please upgrade to access this part.
Upgrade NowMindmap

This section is available to paid users only. Please upgrade to access this part.
Upgrade NowKeywords

This section is available to paid users only. Please upgrade to access this part.
Upgrade NowHighlights

This section is available to paid users only. Please upgrade to access this part.
Upgrade NowTranscripts

This section is available to paid users only. Please upgrade to access this part.
Upgrade Now


5.0 / 5 (0 votes)