Ukuran Pemusatan Data Kelompok
Summary
TLDRIn this video, the presenter explains concepts related to the central tendency of data, focusing on grouped and ungrouped data. Key topics covered include symbols for mean, median, and mode for both populations and samples. The video also delves into the process of organizing data into frequency tables, calculating class boundaries, and determining class intervals. It provides formulas for finding the mean, median, and mode, and demonstrates these calculations through practical examples. The explanation is aimed at helping viewers understand how to calculate and interpret central tendency measures for grouped data.
Takeaways
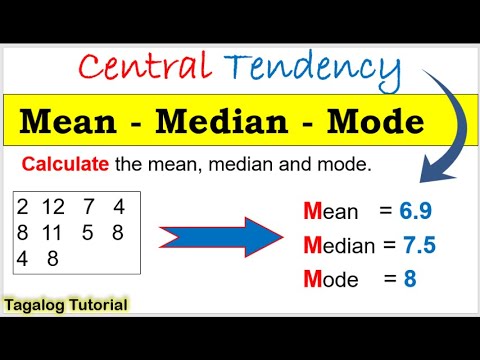
- 😀 The video covers the topic of central tendency measures, including concepts like mean, median, and mode for both population and sample data.
- 😀 For both single and grouped data, the symbols for mean (μ for population and x̄ for sample), median (Me for population and M̄e for sample), and mode (Mo for population and M̄o for sample) are the same.
- 😀 Grouped data refers to data that is organized into frequency tables, which include class intervals, frequency, and cumulative frequency.
- 😀 To create a frequency table from raw data, you first need to determine the sample size (n), the largest and smallest data values, and then calculate the number of classes using the formula: I = 1 + 3.3 log n.
- 😀 The length of each class in a frequency table is determined by dividing the range of the data by the number of classes. The range is calculated by subtracting the smallest value from the largest value.
- 😀 To determine the lower boundary of the first class, start from the smallest data value, and the lower boundary should be slightly smaller than the smallest value but less than the class width.
- 😀 Cumulative frequency is the running total of frequencies, where each class's frequency is added to the total of previous classes.
- 😀 For calculating the mean in grouped data, the formula used is (Σfi * xi) / Σfi, where fi is the frequency of each class and xi is the midpoint of each class.
- 😀 The median of grouped data is calculated using the formula: Me = B + (N/2 - FK) / F * P, where B is the lower boundary of the median class, FK is the cumulative frequency before the median class, F is the frequency of the median class, and P is the class width.
- 😀 The mode for grouped data is calculated using the formula: Mo = B + (D1 / (D1 + D2)) * P, where B is the lower boundary of the modal class, D1 and D2 are the differences between the mode class frequency and the frequencies before and after the modal class, and P is the class width.
Q & A
What is the main focus of this video?
-The main focus of the video is explaining the concept of measures of central tendency, specifically for grouped data, as well as providing an overview of the symbols used for both population and sample data.
What is the difference between grouped data and single data?
-Grouped data refers to a set of data that is presented in a frequency table, while single data consists of individual data points that are not grouped.
What symbols are used to represent the mean in population and sample data?
-In population data, the mean is represented by the symbol 'mu' (μ), while for sample data, it is represented by 'x-bar' (x̄).
How is the frequency table for grouped data structured?
-A frequency table for grouped data includes columns for class intervals (the ranges of values), frequencies (the count of data points within each class), and sometimes cumulative frequencies.
How do you determine the number of classes for grouped data?
-The number of classes is determined using the formula: I = 1 + 3.3 log(n), where 'n' is the sample size.
What is the method for calculating the class width in grouped data?
-The class width is calculated by dividing the range of the data by the number of classes. The range is the difference between the largest and smallest data points.
What is the role of cumulative frequency in grouped data?
-Cumulative frequency is the running total of frequencies from previous classes, showing the number of data points that fall below the upper boundary of each class.
What is the formula for calculating the mean of grouped data?
-The formula for calculating the mean of grouped data is: Σ(f * x) / Σf, where 'f' is the frequency of each class and 'x' is the midpoint of each class.
How do you calculate the median for grouped data?
-To calculate the median for grouped data, you use the formula: Me = B + (N/2 - FK) / F * P, where 'B' is the lower boundary of the median class, 'N' is the total number of data points, 'FK' is the cumulative frequency before the median class, 'F' is the frequency of the median class, and 'P' is the class width.
What is the formula for finding the mode in grouped data?
-The formula for finding the mode in grouped data is: Mo = B + (D1 / (D1 + D2)) * P, where 'B' is the lower boundary of the modal class, 'D1' is the difference between the frequency of the modal class and the previous class, 'D2' is the difference between the frequency of the modal class and the next class, and 'P' is the class width.
Outlines

This section is available to paid users only. Please upgrade to access this part.
Upgrade NowMindmap

This section is available to paid users only. Please upgrade to access this part.
Upgrade NowKeywords

This section is available to paid users only. Please upgrade to access this part.
Upgrade NowHighlights

This section is available to paid users only. Please upgrade to access this part.
Upgrade NowTranscripts

This section is available to paid users only. Please upgrade to access this part.
Upgrade NowBrowse More Related Video

STATISTIKA: Ukuran gejala pusat dan ukuran letak 1

UKURAN PEMUSATAN DATA BERKELOMPOK | Rataan Median Modus Kuartil Desil Persentil

Statistika Dasar Ukuran Pemusatan Data (Mean, Modus, Median) Data Tunggal dan Data Kelompok
Grade 8 Measure of central tendency: Mean, median, mode for ungrouped data week 1 #math8 #matatag
Statistika #3 Ukuran Pemusatan : Mean - Modus - Median | Kelas X Fase E Kurikulum Merdeka

ଆସିଗଲା +2 Board Education Selection MCQ|+2 board 2026 education MCQ|Unit 4|Mcq|Unit 4|Plus two exam|
5.0 / 5 (0 votes)