Statistika Dasar Ukuran Pemusatan Data (Mean, Modus, Median) Data Tunggal dan Data Kelompok
Summary
TLDRThis video tutorial introduces basic statistics, focusing on measures of central tendency, such as mean, mode, and median. The presenter explains how to calculate these values for both individual data points and grouped data using formulas and examples. Key concepts include calculating the simple mean, weighted mean, and group mean. Additionally, the tutorial covers how to determine the mode (most frequent value) and median (middle value) in both individual and grouped data. Practical examples help viewers understand the application of these statistical measures, making the content accessible for learners and researchers alike.
Takeaways
- 😀 The video provides an introduction to basic statistics, focusing on measures of central tendency like mean, mode, and median.
- 😀 The importance of statistics in everyday life is emphasized, with examples like average salary, income per capita, and average age.
- 😀 The first key measure explained is the mean, also known as 'average', and how it can be calculated for both individual and grouped data.
- 😀 For individual data, the mean formula is the sum of all data points divided by the number of data points.
- 😀 For grouped data, the weighted mean formula is introduced, where frequencies (F) of data points are multiplied by the corresponding values (X) and then divided by the total frequencies.
- 😀 Mode is defined as the most frequently occurring data point in a dataset, with a separate explanation for both individual and grouped data.
- 😀 In grouped data, the mode is calculated using a specific formula involving class frequencies, with additional components like the class width and differences in frequencies.
- 😀 The median is introduced as the middle value when the data is sorted, with separate formulas for odd and even numbered datasets.
- 😀 For even-numbered data, the median is the average of the two middle values, while for odd-numbered data, it's the value at the center position.
- 😀 The video also provides step-by-step examples for calculating the mean, mode, and median with both individual and grouped datasets, ensuring clarity in the application of formulas.
Q & A
What is the main focus of the video tutorial?
-The main focus of the video tutorial is on basic statistics, specifically the measures of central tendency, including mean, mode, and median.
What are the two types of mean calculations discussed in the video?
-The video discusses two types of mean calculations: the simple arithmetic mean (or average) for ungrouped data and the weighted mean for grouped data.
What is the formula for calculating the simple arithmetic mean?
-The formula for calculating the simple arithmetic mean is the sum of all data points divided by the number of data points, represented as ΣX / N.
How is the weighted mean calculated?
-The weighted mean is calculated by multiplying each data point by its frequency (F) and then dividing the sum of these products by the total frequency, represented as Σ(F * X) / ΣF.
How can you calculate the mean from a grouped data table?
-To calculate the mean from grouped data, first compute the midpoint (XT) for each class interval. Then multiply the frequency of each class by the corresponding midpoint, sum those products, and divide by the total frequency.
What is the mode in statistics?
-The mode is the value that appears most frequently in a data set.
How do you calculate the mode for grouped data?
-To calculate the mode for grouped data, use the formula that involves the class interval with the highest frequency (the modal class). The formula incorporates the boundaries of the modal class, the frequencies of the modal class, and its adjacent classes.
What is the difference between the median for odd and even data sets?
-For odd data sets, the median is the middle value when the data is ordered. For even data sets, the median is the average of the two middle values.
How is the median for grouped data calculated?
-To calculate the median for grouped data, use the formula that considers the cumulative frequency, the class interval that contains the median, and the frequency values of the adjacent classes.
What practical applications of the mean were mentioned in the video?
-The video mentions practical applications of the mean, such as calculating average employee salaries, average income per capita, and average student scores.
Outlines

This section is available to paid users only. Please upgrade to access this part.
Upgrade NowMindmap

This section is available to paid users only. Please upgrade to access this part.
Upgrade NowKeywords

This section is available to paid users only. Please upgrade to access this part.
Upgrade NowHighlights

This section is available to paid users only. Please upgrade to access this part.
Upgrade NowTranscripts

This section is available to paid users only. Please upgrade to access this part.
Upgrade NowBrowse More Related Video

Statistics: The average | Descriptive statistics | Probability and Statistics | Khan Academy
Statistika - Ukuran Pemusatan Data (Mean, Median, Modus)
Statistik Deskriptif
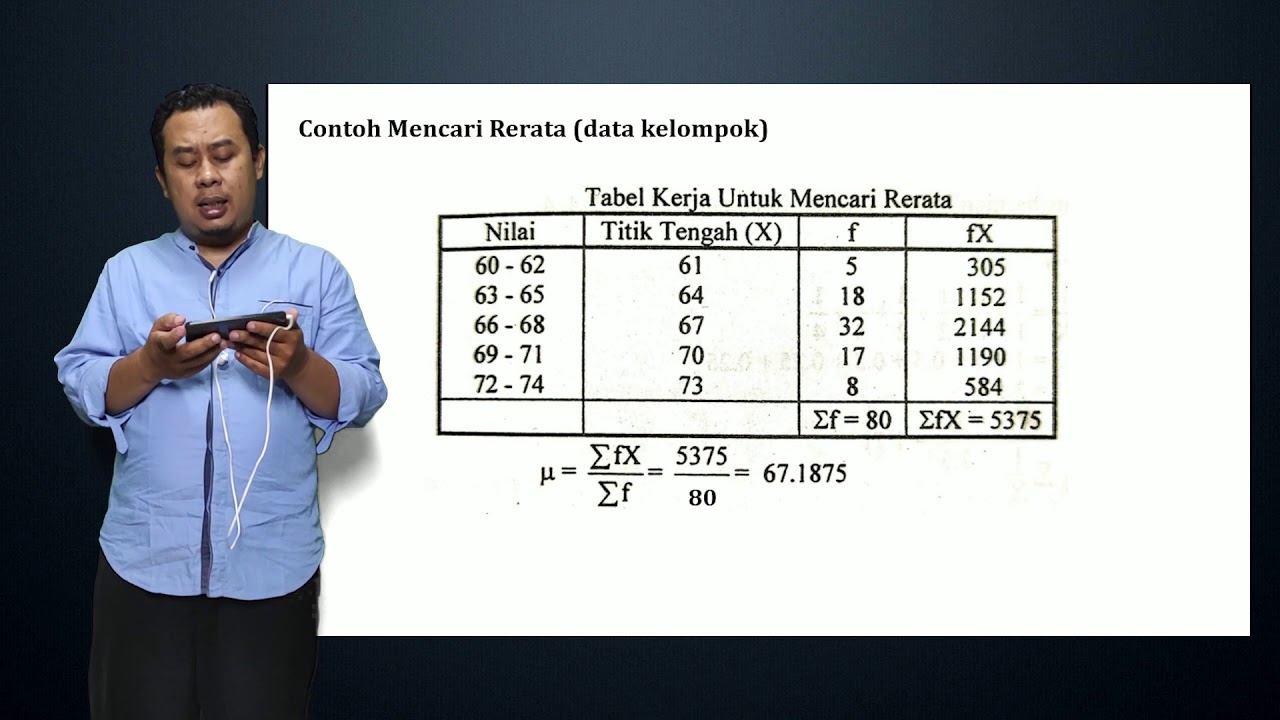
STATISTIKA PENELITIAN # 7 # (MATERI) TENDENSI SENTRAL (rerata, median, dan modus)
2.5 Medidas descriptivas

Statistika 1 ~ Ukuran Pemusatan Data (Mean/Rata-Rata, Median, Modus) ~ Materi PJJ Kelas VIII / 8 SMP
5.0 / 5 (0 votes)