Membaca Grafik Dalam Bahasa Inggris || Eni Kesuma
Summary
TLDRThis video explains how to effectively present data using different types of graphs, including bar graphs, pie charts, and line charts. It provides practical tips for describing data in English using specific verbs, adverbs, and prepositions. The presenter demonstrates how to combine these elements to describe trends and comparisons in a clear and professional manner. Viewers are encouraged to practice using these structures to enhance their ability to present data in English.
Takeaways
- 😀 Graphs are a way of presenting data and information in visual formats such as tables or images.
- 😀 Graphs are commonly used to compare data over different periods of time.
- 😀 There are three main types of graphs: bar charts, pie charts, and line charts.
- 😀 Bar charts represent data with bars, making it easy to compare different categories.
- 😀 Pie charts present data in percentage form, showing the proportion of each category.
- 😀 Line charts use dots connected by lines to represent data, often showing trends over time.
- 😀 The script explains how to describe graphs in English, emphasizing the use of prepositions and verbs.
- 😀 It is essential to use appropriate vocabulary to make your descriptions of graphs sound more elegant and engaging.
- 😀 Example sentences are provided to help describe data trends in graphs, such as 'the visitor arrivals increased' or 'there was a significant drop.'
- 😀 The video concludes by encouraging viewers to practice using these techniques and to engage with the channel by liking, commenting, and subscribing.
Q & A
What is the main topic of the video?
-The video discusses how to present and interpret graphs or charts, particularly in the context of using the English language for graph descriptions.
What is a graph, according to the video?
-A graph is a representation of data and information in the form of a table that is visually presented as an image. Graphs are used to compare information, such as data from different time periods.
What are the three main types of graphs mentioned in the video?
-The three main types of graphs mentioned are: 1) Bar graphs (using bars for data representation), 2) Pie charts (showing data as percentages), and 3) Line charts (connecting data points with lines).
Why are graphs useful?
-Graphs are useful because they allow for the visual representation of data, making it easier to compare and analyze information over time or across different categories.
How does the video suggest presenting a graph in English?
-The video suggests using various phrases, verbs, prepositions, and adjectives to describe the graph, such as 'The vertical axis represents the number of visitors,' and combining these elements to make the description more elegant and engaging.
What is the significance of the vertical and horizontal axes in a graph?
-The vertical axis (y-axis) usually represents the data being measured, such as the number of visitors, while the horizontal axis (x-axis) represents the time or category that the data is being compared across.
What are some useful verbs and adverbs for describing data in graphs?
-Some useful verbs include 'increase,' 'decrease,' 'rise,' and 'fall,' while adverbs like 'significantly,' 'slightly,' and 'drastically' can help describe the extent of changes in data.
Can you give an example sentence from the video on how to describe graph data?
-An example sentence from the video is: 'From February to March, the number of visitor arrivals increased from 200 to 300 people.'
What was the specific example graph used in the video?
-The specific example in the video showed a bar graph illustrating the number of visitors to Bali in 2019, showcasing changes in the number of arrivals over various months.
What is the closing message of the video?
-The video closes by encouraging viewers to subscribe, like, and comment, and also invites suggestions or feedback from the audience. It ends with a farewell and promises to see the viewers in the next video.
Outlines

This section is available to paid users only. Please upgrade to access this part.
Upgrade NowMindmap

This section is available to paid users only. Please upgrade to access this part.
Upgrade NowKeywords

This section is available to paid users only. Please upgrade to access this part.
Upgrade NowHighlights

This section is available to paid users only. Please upgrade to access this part.
Upgrade NowTranscripts

This section is available to paid users only. Please upgrade to access this part.
Upgrade NowBrowse More Related Video
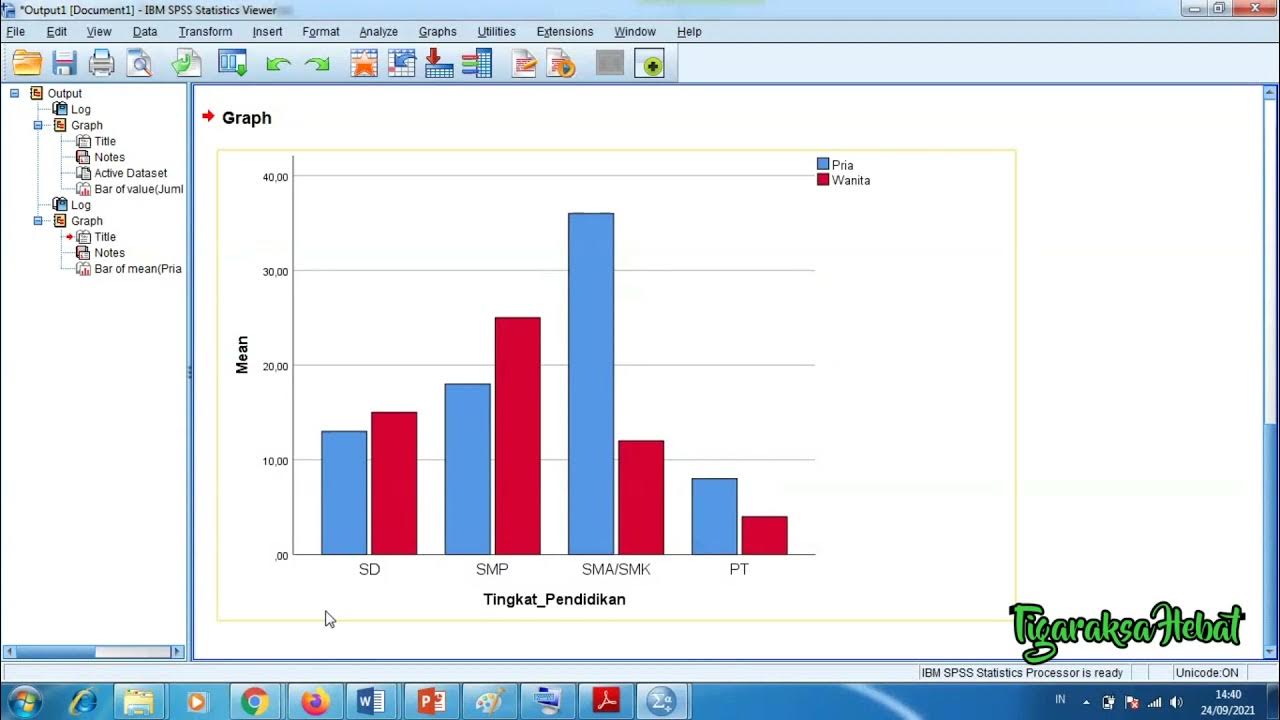
Penyajian Data Statistik Menggunakan SPSS

Video Pembelajaran Matematika Kelas 7 SMP ( Pengolahan Data )
Penyajian Data (Part-1) ~ Tabel dan Diagram (Materi PJJ Kelas VII / 7 SMP)
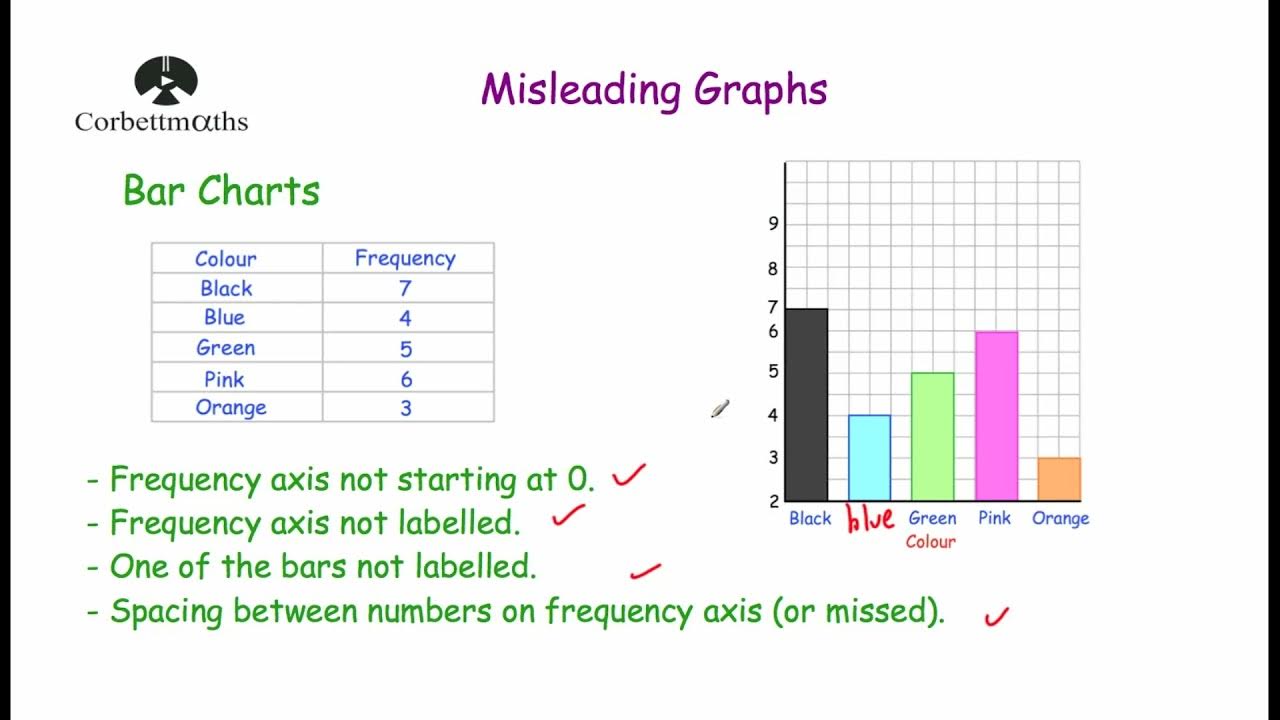
Misleading Graphs - Corbettmaths

1 PENYAJIAN DATA - STATISTIKA - KELAS 7 SMP
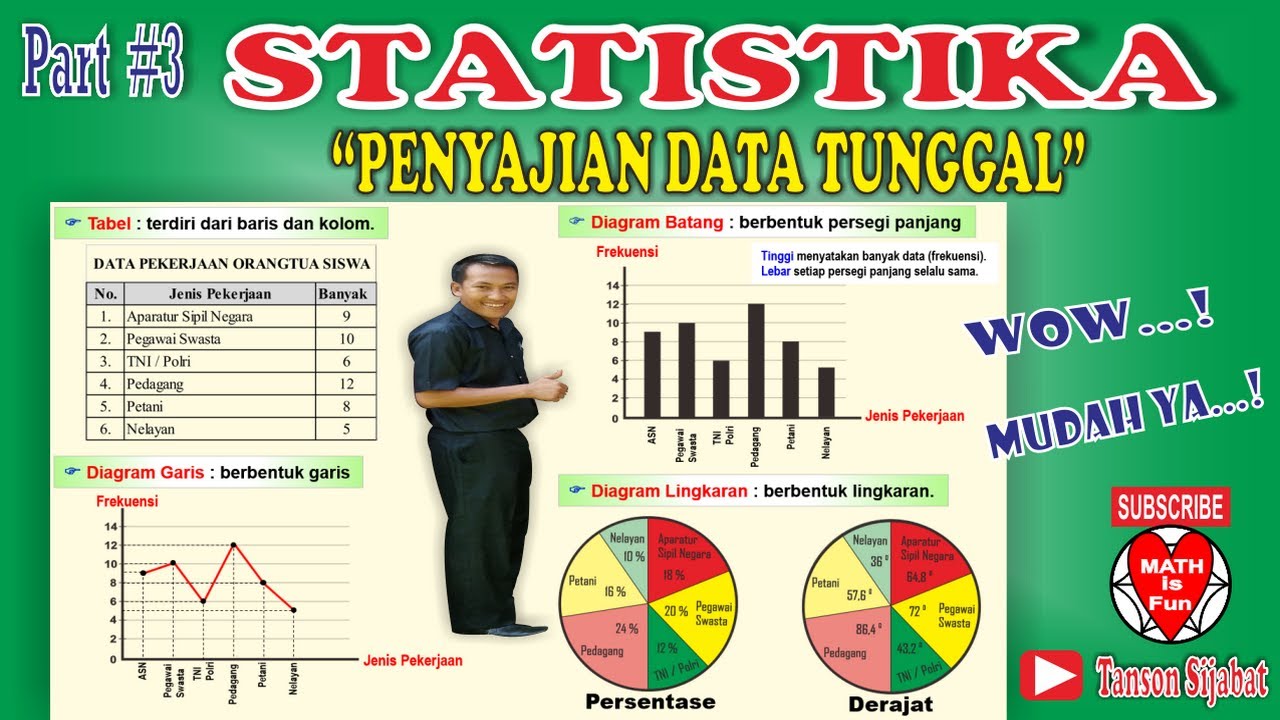
STATISTIKA | PENYAJIAN DATA TUNGGAL [Tabel, Diagram Garis, Diagram Batang, Lingkaran]
5.0 / 5 (0 votes)