Video Pembelajaran Matematika Kelas 7 SMP ( Pengolahan Data )
Summary
TLDRIn this educational video, students will learn about data processing, including how to collect, organize, and interpret data in various forms such as tables, line charts, bar graphs, and pie charts. The video covers methods of data collection, such as interviews and questionnaires, and guides viewers through reading data from lists, tables, and graphical representations. The content also introduces how to interpret data through different types of charts and graphs, helping students develop essential skills for analyzing and presenting data effectively. This lesson aims to improve students' ability to analyze relationships in data and present their findings clearly.
Takeaways
- 😀 Data processing involves analyzing relationships between data and presenting it in different formats such as tables, bar diagrams, line diagrams, and pie charts.
- 😀 Students are expected to gather, organize, and interpret data effectively, helping them understand how data is presented and interpreted.
- 😀 Data can be collected through direct methods, such as interviews, or indirect methods, like surveys.
- 😀 One way to read data is through lists, which present clear numerical information, like the favorite sports of students in a class.
- 😀 Data can also be presented in tables, making it easier to interpret and understand patterns, such as student preferences for activities.
- 😀 Visual representation of data can be done through picture diagrams, where each image represents a specific quantity, simplifying the analysis.
- 😀 In a picture diagram, one image can represent a set number of items, such as 10 books, which helps in visualizing data quickly.
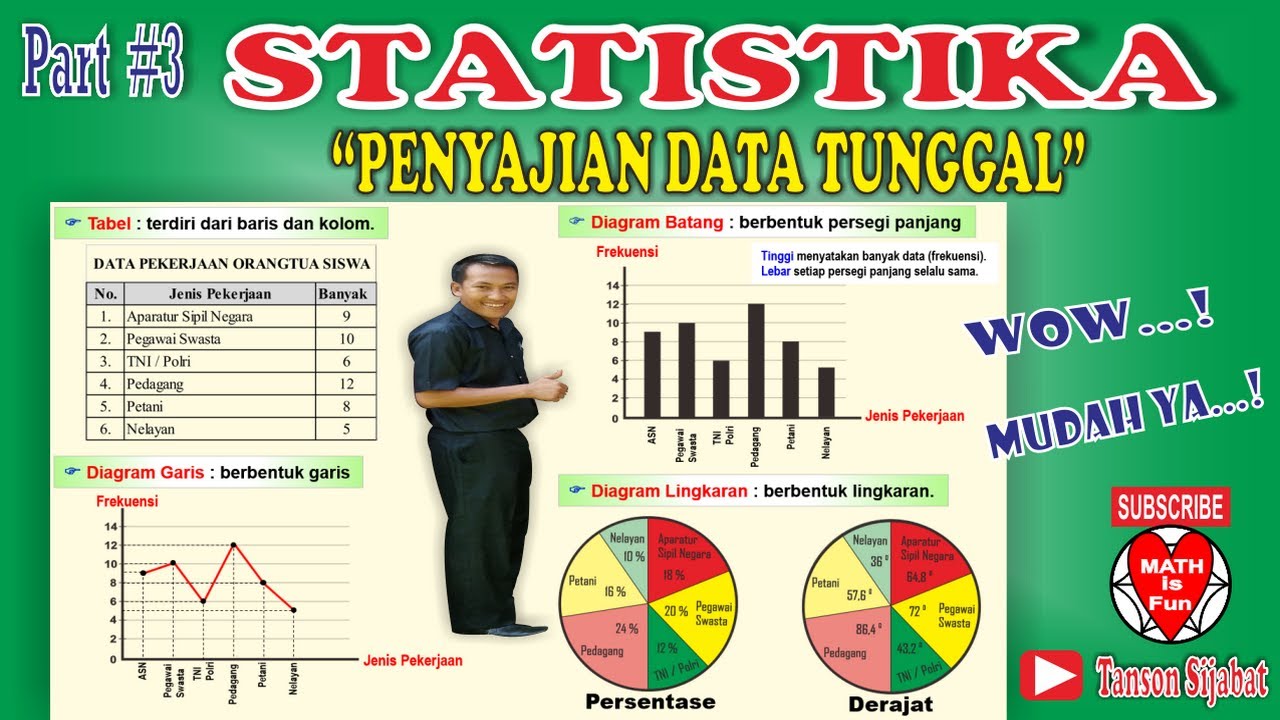
- 😀 Bar diagrams represent data in the form of bars, making it easy to see comparisons between different values, like students' grades.
- 😀 Line diagrams show trends over time, such as changes in a student's weight, providing a clear visual representation of progression or growth.
- 😀 Pie charts are useful for showing proportions, where each segment represents a portion of the total data, like the percentage of students preferring different fruits.
- 😀 When working with pie charts, percentages are used to interpret the data, but it's important to also understand how to convert percentages into degrees for better visualization in charts.
Q & A
What is the main focus of this video?
-The video focuses on teaching data processing, including how to collect, organize, present, and interpret data using tables, line graphs, bar charts, and pie charts.
What competencies should students have after completing this lesson?
-Students should be able to collect and organize data, present it in tables and graphs, and interpret data presented in various forms, such as bar charts, line graphs, and pie charts.
What are some ways data can be collected according to the script?
-Data can be collected both directly, such as through interviews, and indirectly, like using questionnaires.
How does the script suggest we read data in a list format?
-The script explains that reading data in list format involves looking at the number of students who prefer each activity, such as how many students enjoy football, futsal, basketball, etc.
How do students interpret data from tables according to the script?
-Students should interpret data by looking at the number of students who prefer different activities as presented in the table, for example, six students like painting, five like dancing, etc.
What is the key feature of a pictorial diagram as explained in the video?
-A pictorial diagram uses images to represent data, where each image (e.g., a book) stands for a set number of items, like 10 books representing one picture.
How do bar charts represent data?
-Bar charts represent data using bars, where the height of the bar indicates the number of students or items. For example, a bar might show that 10 students received a grade of 8.
What is the purpose of a line graph in the context of this lesson?
-A line graph is used to show data over time. In the script, an example of weight changes over several months is presented, showing how the weight of a person (Mita) increased each month.
What is unique about interpreting data from a pie chart?
-Interpreting data from a pie chart involves understanding the percentage of each category. The script provides an example with 40 students, showing how the percentage of students who like different fruits can be converted into actual student numbers.
How do percentages in pie charts relate to the number of students?
-Percentages in pie charts are converted to actual student numbers by multiplying the percentage by the total number of students. For example, 20% of 40 students means 8 students like apples.
Outlines

This section is available to paid users only. Please upgrade to access this part.
Upgrade NowMindmap

This section is available to paid users only. Please upgrade to access this part.
Upgrade NowKeywords

This section is available to paid users only. Please upgrade to access this part.
Upgrade NowHighlights

This section is available to paid users only. Please upgrade to access this part.
Upgrade NowTranscripts

This section is available to paid users only. Please upgrade to access this part.
Upgrade NowBrowse More Related Video

Penyajian Data (Part-1) ~ Tabel dan Diagram (Materi PJJ Kelas VII / 7 SMP)

Pengantar Statistika Kelas 7 SMP

Penyajian Data | Matematika SMP Kelas 7
Penyajian Data Statistik Menggunakan SPSS

1 PENYAJIAN DATA - STATISTIKA - KELAS 7 SMP
STATISTIKA | PENYAJIAN DATA TUNGGAL [Tabel, Diagram Garis, Diagram Batang, Lingkaran]
5.0 / 5 (0 votes)