Statistika - Ukuran Letak Data (Kuartil, Desil, Persentil)
Summary
TLDRIn this educational video, the instructor explains key statistical concepts, focusing on measures of data centrality such as quartiles, percentiles, and deciles. The video breaks down how to calculate these measures for both single data points and grouped data, using formulas and examples. The video emphasizes how these measures divide data into equal parts to identify central tendencies and distribution patterns. It also highlights practical applications, offering step-by-step instructions for determining the quartile, decile, and percentile values, and provides insights into interpreting these statistics for better understanding and analysis of data.
Takeaways
- 😀 Median is the value in the middle of a dataset when the data is ordered, splitting the data into two equal parts.
- 😀 Quartiles divide data into four equal parts, with Q1 being the lower 25%, Q2 as the median, and Q3 being the upper 75%.
- 😀 Desiles divide data into 10 equal parts, with each desile corresponding to 10% intervals of the data.
- 😀 Percentiles divide data into 100 equal parts, with each percentile representing 1% of the data.
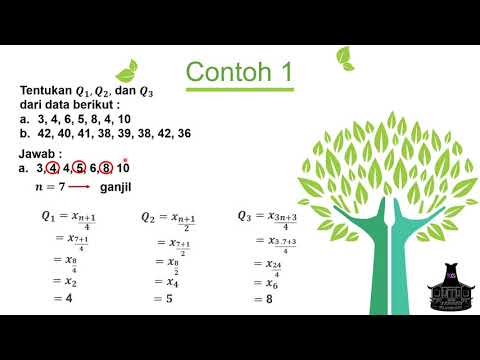
- 😀 To calculate Q1, Q2, or Q3, use the formula (n+1)/4, where 'n' is the total number of data points.
- 😀 For a set of data, to find Q1, Q2, or Q3, locate the corresponding data point after applying the quartile formula.
- 😀 Desile values can be calculated using the formula for Q1, but with a divisor of 10 instead of 4.
- 😀 Percentiles work similarly to quartiles, but the divisor changes to 100, and they help locate values at finer intervals.
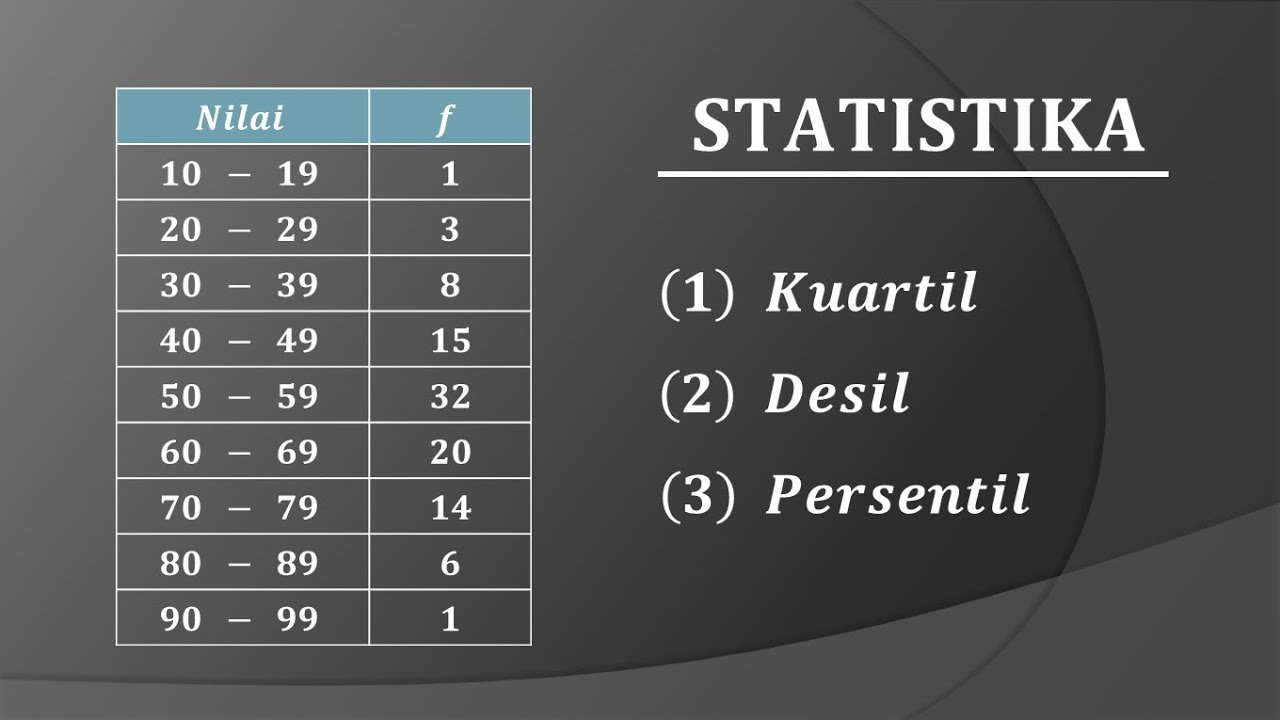
- 😀 For grouped data, calculate the class intervals and cumulative frequencies to determine the relevant quartile, desile, or percentile.
- 😀 To find the exact position for percentiles, desiles, or quartiles in grouped data, use the formula with frequency cumulative sums.
- 😀 The process for calculating values in grouped data includes identifying the class of interest, adjusting boundaries, and applying the formulas.
Q & A
What is the median in statistics?
-The median is the middle value of a dataset when the data is arranged in order. It divides the data into two equal parts, with half the values above and half below the median.
How are quartiles used in statistics?
-Quartiles divide a dataset into four equal parts. There are three quartiles: Q1 (lower quartile), Q2 (median), and Q3 (upper quartile), which represent the 25th, 50th, and 75th percentiles of the data, respectively.
What is the difference between quartiles and percentiles?
-Quartiles divide data into four equal parts, while percentiles divide data into 100 equal parts. Quartiles are specific types of percentiles, with Q1 representing the 25th percentile, Q2 the 50th percentile (median), and Q3 the 75th percentile.
How do you calculate the first quartile (Q1)?
-To calculate Q1, first order the data. Then, use the formula: Q1 = (N+1)/4, where N is the number of data points. The result gives the position of Q1 in the ordered dataset.
What is the role of cumulative frequency in calculating quartiles?
-Cumulative frequency helps to identify the position of a specific quartile in grouped data. By calculating the cumulative frequency, you can determine the class that contains the desired quartile.
How is decile different from quartile?
-Deciles divide the data into 10 equal parts, whereas quartiles divide the data into 4 equal parts. Each decile represents 10% of the data, while quartiles represent 25%.
What is the formula for calculating deciles?
-The formula for calculating deciles is similar to that of quartiles. For the ith decile, use the formula: D_i = (i * (N+1)) / 10, where i is the decile number and N is the total number of data points.
What is the relationship between Q2 and the median?
-Q2 is the median of the dataset. It is the middle value that divides the dataset into two equal halves, and it represents the 50th percentile.
How do you calculate percentiles?
-Percentiles divide the data into 100 equal parts. To calculate the pth percentile, use the formula: P_p = (p * (N+1)) / 100, where p is the percentile number and N is the total number of data points.
How are the methods for calculating quartiles, deciles, and percentiles similar?
-The methods for calculating quartiles, deciles, and percentiles are similar in that they all involve finding the position of the desired measure in an ordered dataset and using formulas based on the total number of data points. The main difference is how the data is divided—quartiles into 4 parts, deciles into 10, and percentiles into 100.
Outlines

This section is available to paid users only. Please upgrade to access this part.
Upgrade NowMindmap

This section is available to paid users only. Please upgrade to access this part.
Upgrade NowKeywords

This section is available to paid users only. Please upgrade to access this part.
Upgrade NowHighlights

This section is available to paid users only. Please upgrade to access this part.
Upgrade NowTranscripts

This section is available to paid users only. Please upgrade to access this part.
Upgrade NowBrowse More Related Video
Ukuran Penyebaran Data : Kuartil, Desil dan Persentil + Contoh Soal

UKURAN PEMUSATAN DATA BERKELOMPOK | Rataan Median Modus Kuartil Desil Persentil

CARA MENCARI NILAI KUARTIL DESIL PERSENTIL UKURAN LETAK II DATA TUNGGAL

MEASURES OF POSITION FOR UNGROUPED DATA

MEASURES OF POSITION OF GROUPED DATA | MATHEMATICS IN THE MODERN WORLD
STATISTIKA : Cara mudah menentukan nilai Quartil Desil dan Persentil data kelompok
5.0 / 5 (0 votes)