MEASURES OF POSITION OF GROUPED DATA | MATHEMATICS IN THE MODERN WORLD
Summary
TLDRIn this educational video, the instructor explains how to calculate quartiles, deciles, and percentiles for grouped data. Using a sample data set of student quiz scores, the video breaks down the process step-by-step, from finding lower boundaries to calculating cumulative frequencies. The formulas for quartiles, deciles, and percentiles are applied to find the first quartile (23.05), the ninth decile (51), and the 70th percentile (33.3). Viewers are encouraged to follow along and subscribe for more tutorials on statistical analysis and data interpretation.
Takeaways
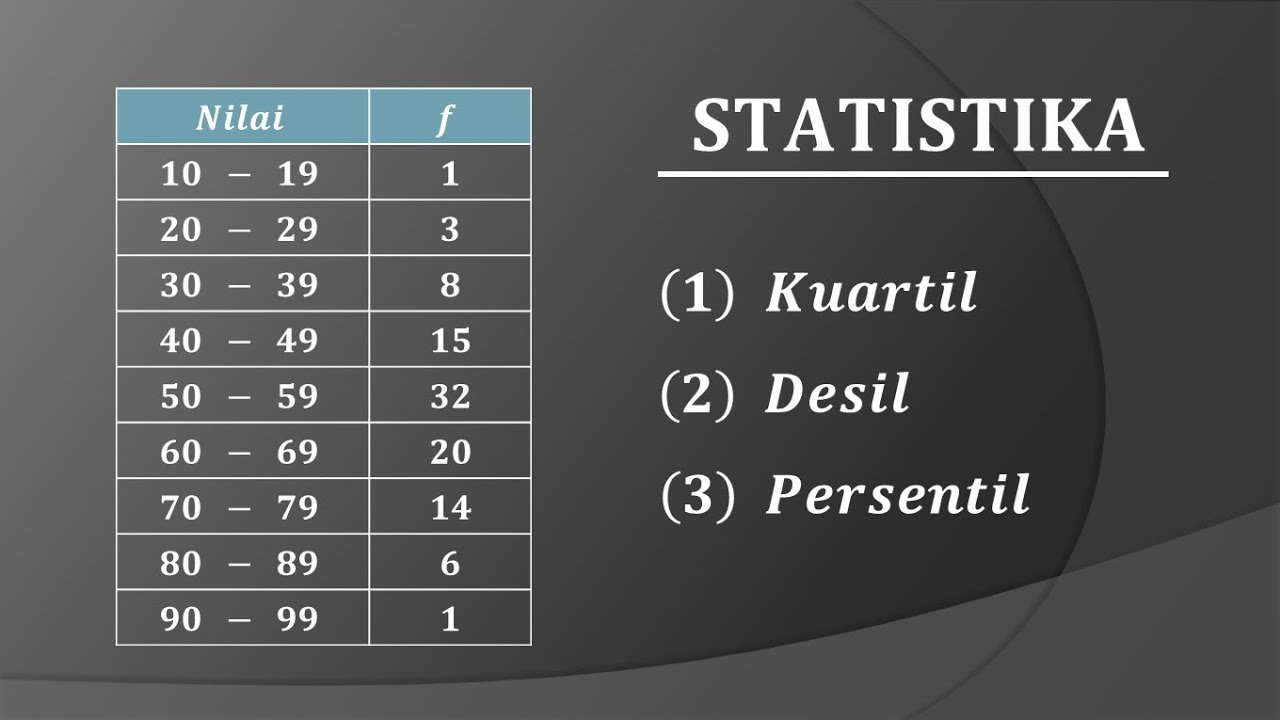
- 😀 The video covers how to calculate quartiles, deciles, and percentiles for grouped data.
- 😀 The formula used in the video involves the lower boundary, cumulative frequency, class width, and frequency of classes.
- 😀 The value of 'i' in the formula varies depending on whether you're calculating quartiles (i=4), deciles (i=10), or percentiles (i=100).
- 😀 The first step to calculating quartiles and deciles is determining the lower boundary of each class by subtracting 0.5 from the lower limit.
- 😀 Cumulative frequency must be calculated by adding the frequencies of the previous classes, starting with the first class.
- 😀 For quartile calculation, divide the total number of observations by 4 (for Q1), and use the cumulative frequency to find the class where the first quartile lies.
- 😀 For deciles, calculate the required position (9th decile in the example), and similarly use the cumulative frequency to find the corresponding class.
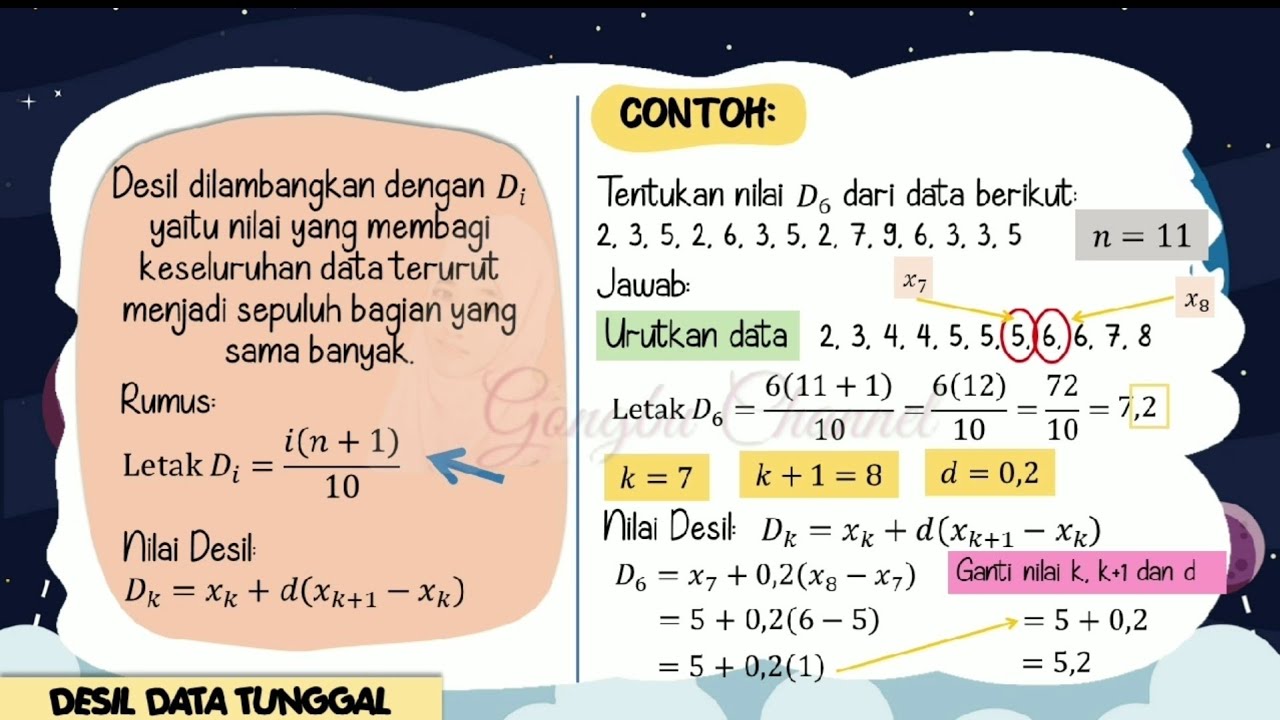
- 😀 Percentiles are calculated similarly to quartiles and deciles but with a different formula based on the percentile number (e.g., the 70th percentile in the example).
- 😀 The formula for quartile, decile, and percentile is then applied using the lower boundary, cumulative frequency, and class width to find the desired position.
- 😀 The final values for the first quartile (23.05), ninth decile (51), and 70th percentile (33.3) are calculated using these steps, demonstrating the method's effectiveness.
Q & A
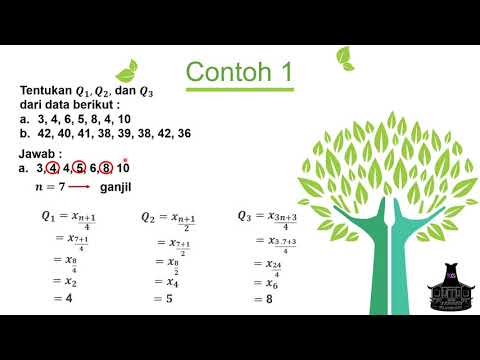
What is the purpose of calculating quartiles, deciles, and percentiles for grouped data?
-These measures help to understand the distribution of data by dividing it into specific intervals. They give insights into how the data is spread and allow for better analysis of central tendency and variation.
What does the 'L' represent in the formula used for quartiles, deciles, and percentiles?
-'L' represents the lower boundary of the class interval. It is calculated by subtracting 0.5 from the lower limit of the class.
How is the cumulative frequency (CF) determined?
-The cumulative frequency is calculated by successively adding the frequencies of each class starting from the first class up to the current class.
What is the significance of the class width (CW) in the formula?
-The class width (CW) represents the size of each class interval and is crucial in determining the exact value of the quartile, decile, or percentile.
What is the formula for calculating the first quartile (Q1)?
-The formula for the first quartile is: Q1 = L + [(kN / i) - CF] / f × CW, where 'L' is the lower boundary, 'kN/i' is the position of the quartile, 'CF' is the cumulative frequency of the preceding class, 'f' is the frequency of the current class, and 'CW' is the class width.
How is the first quartile (Q1) calculated in the given example?
-In the example, Q1 is calculated by finding the 10th position (1/4 of 40 students = 10), which falls in the 23–28 class. The lower boundary of this class is 22.5, and the class width is 6. Using the formula, the first quartile is found to be 23.05.
What is the purpose of the index 'i' in the formula, and how does it differ for quartiles, deciles, and percentiles?
-The index 'i' represents the number of divisions for each measure. For quartiles, 'i' is 4, for deciles 'i' is 10, and for percentiles 'i' is 100. It helps in determining the specific position within the data for each measure.
What is the method for calculating the ninth decile (D9) in the example?
-To calculate the ninth decile, we first find the 36th position (9/10 of 40 = 36). The 36th position is in the 41–46 class. Using the formula, the ninth decile is found to be 51.
How is the 70th percentile (P70) determined in the provided example?
-To calculate the 70th percentile, we find the 28th position (70/100 of 40 = 28). This position is in the 29–34 class. Using the formula, the 70th percentile is found to be 33.3.
Why is subtracting 0.5 from the lower limit necessary to find the lower boundary?
-Subtracting 0.5 from the lower limit adjusts the class interval to ensure that the boundary accurately represents the starting point of the class interval in continuous data, preventing overlaps with the next class.
Outlines

This section is available to paid users only. Please upgrade to access this part.
Upgrade NowMindmap

This section is available to paid users only. Please upgrade to access this part.
Upgrade NowKeywords

This section is available to paid users only. Please upgrade to access this part.
Upgrade NowHighlights

This section is available to paid users only. Please upgrade to access this part.
Upgrade NowTranscripts

This section is available to paid users only. Please upgrade to access this part.
Upgrade NowBrowse More Related Video
Ukuran Penyebaran Data : Kuartil, Desil dan Persentil + Contoh Soal

UKURAN PEMUSATAN DATA BERKELOMPOK | Rataan Median Modus Kuartil Desil Persentil
Ukuran Letak Data Tunggal (Kuartil, Desil dan Persentil)

Statistika Bagian 6 - Persentil Data Tunggal dan Data Kelompok Matematika Wajib Kelas 12

Statistika - Ukuran Letak Data (Kuartil, Desil, Persentil)
STATISTIKA : Cara mudah menentukan nilai Quartil Desil dan Persentil data kelompok
5.0 / 5 (0 votes)