How to Make a Bar Graph in Excel
Summary
TLDRIn this tutorial, Maria from EasyClick Academy demonstrates how to create a bar graph in Excel. She walks viewers through selecting data, inserting the graph, and customizing its design, title, and colors. Additionally, Maria highlights the dynamic nature of Excel graphs, showing how updates to the source data are automatically reflected in the graph. Perfect for beginners, this step-by-step guide makes Excel’s charting tools easy to understand and use, ensuring users can present their data in a clear and engaging way.
Takeaways
- 😀 Using a graph in Excel helps present data visually and effectively.
- 😀 This tutorial is part of the EasyClick Academy series, aimed at making Excel easy to use.
- 😀 Excel offers various chart types, and selecting the right one is crucial for clarity and engagement.
- 😀 Previous tutorials covered creating line and pie charts, and this one focuses on bar graphs.
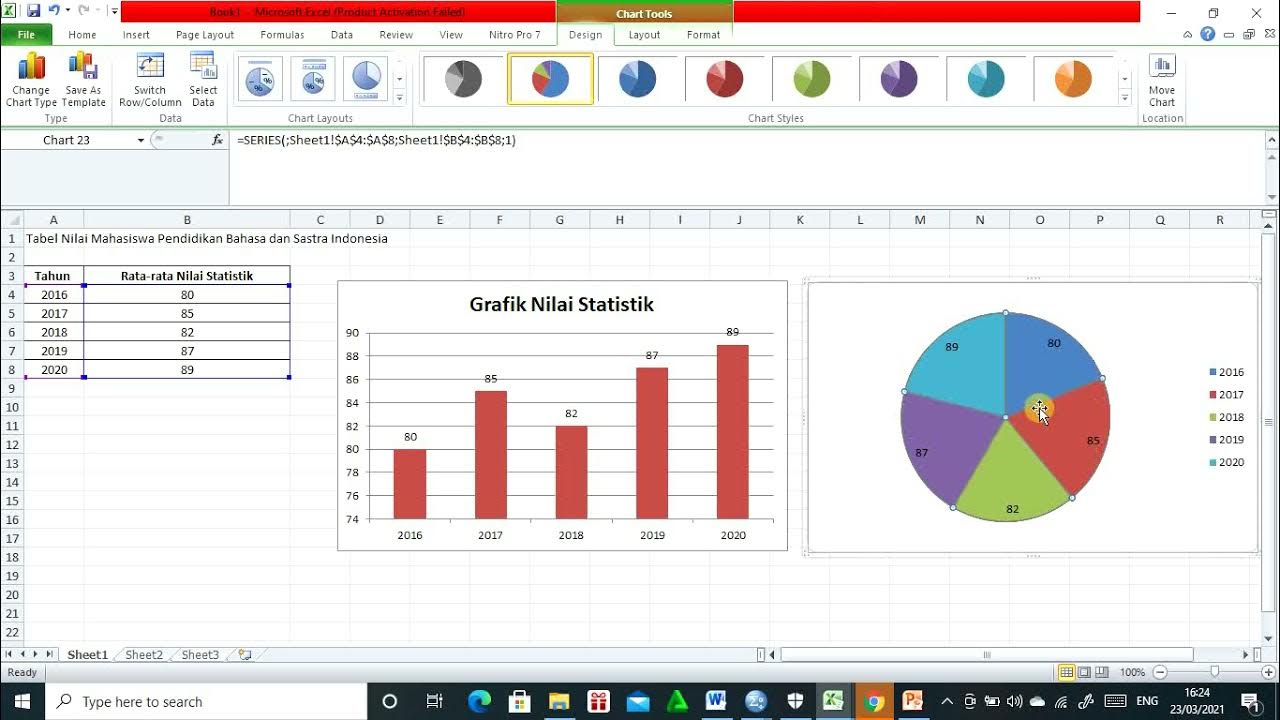
- 😀 To create a bar graph, select the relevant data, go to the ‘Insert’ tab, and choose the bar chart option.
- 😀 You can move and resize the chart by clicking and dragging within the graph area.
- 😀 The chart title can be customized by clicking on the default ‘Chart Title’ and entering a new name.
- 😀 Excel allows easy color and design changes through the ‘Design’ tab, including ‘Change Colour’ and ‘Chart Styles’ options.
- 😀 The chart design can be further customized by selecting styles from a drop-down menu in the ‘Chart Styles’ section.
- 😀 Excel charts are dynamic, so any changes made to the data in the source table are automatically reflected in the graph.
- 😀 The tutorial encourages viewers to like, subscribe, and explore more EasyClick Academy tutorials for further Excel tips.
Q & A
What is the main focus of this tutorial?
-This tutorial focuses on teaching how to create a simple bar graph in Excel and customizing it to present data effectively.
Why are graphs useful when working with data?
-Graphs are useful because they present data in a visual format, making it easier to understand and interpret, which enhances communication and engagement.
What other types of graphs were covered in previous tutorials?
-In previous tutorials, the video covered how to create line graphs and pie charts in Excel.
How do you select data to create a bar graph in Excel?
-To create a bar graph, first, select the area containing the data you want to present. Then, go to the 'Insert' tab and choose the bar graph option under the 'Charts' section.
How can you move the graph to a different location in the Excel sheet?
-To move the graph, click on any blank space within the chart area, hold the left mouse button, and drag the graph to the desired location within the spreadsheet.
How can you adjust the size of the graph in Excel?
-To adjust the graph size, click on any of the corner circles of the graph area, then drag in any direction to resize it as needed.
How do you change the title of the graph?
-To change the title, click on the default title ('Chart Title') and edit it directly by typing in your desired title.
What customization options are available for graph colors and design in Excel?
-You can change the colors of the chart by selecting the 'Design' tab and clicking on 'Change Colour'. Additionally, the entire graph design can be customized by selecting 'Chart Styles' in the same tab.
What happens if the data in the source table changes after creating the graph?
-Excel graphs are dynamic, meaning that if any data in the source table changes, the graph will automatically update to reflect those changes.
How do you update the graph when the data changes, for example, for the sales figure of August?
-To update the graph, simply change the value in the source table (e.g., change the sales figure for August), and the graph will immediately update to reflect this new data.
Outlines

This section is available to paid users only. Please upgrade to access this part.
Upgrade NowMindmap

This section is available to paid users only. Please upgrade to access this part.
Upgrade NowKeywords

This section is available to paid users only. Please upgrade to access this part.
Upgrade NowHighlights

This section is available to paid users only. Please upgrade to access this part.
Upgrade NowTranscripts

This section is available to paid users only. Please upgrade to access this part.
Upgrade NowBrowse More Related Video

How to Integrate ChatGPT into Excel (Easy Integration)

How to Make a Graph in Excel | Learn Microsoft Excel

Tutorial Lengkap Membuat Diagram Batang Keren di Canva

Cara membuat Diagram Batang, Diagram Lingkaran, dan Diagram Garis

Cara Membuat Grafik di Microsoft Excel (2021)

Visualisasi Data dengan Chart Microsoft Excel
5.0 / 5 (0 votes)