8. Market Trends - Examples
Summary
TLDRThis video lesson explores market trends, focusing on bullish and bearish structures, and the importance of understanding impulse and correction phases. The instructor emphasizes applying theory to live markets for hands-on experience and explains how trends behave across different timeframes. The video walks through examples of weak and strong bullish trends on the EUR/JPY daily chart and illustrates how multi-timeframe analysis reveals trends within trends. Additionally, it covers key concepts such as reversals, corrective phases, and momentum, preparing traders to better navigate and trade in trending conditions.
Takeaways
- 📈 The focus is on understanding trends in the market, including bullish and bearish structures, and how to apply theoretical knowledge to real market scenarios.
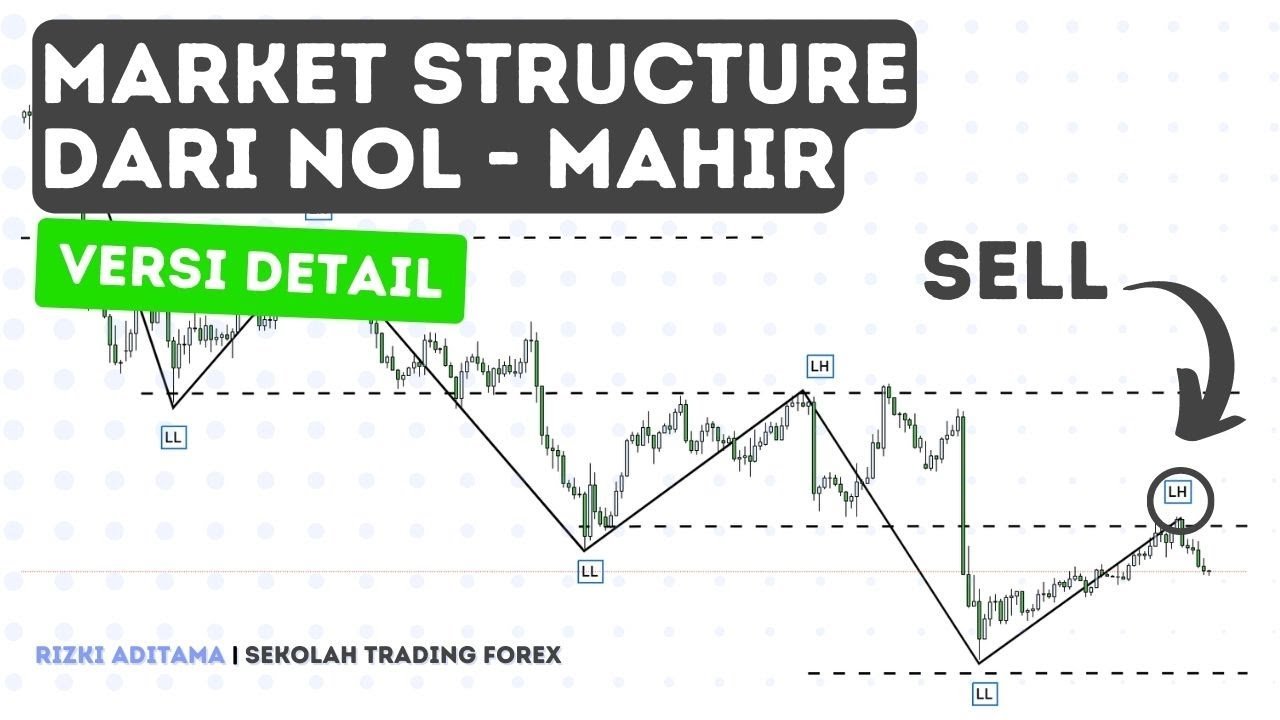
- 🛠 Mapping out highs and lows is crucial for identifying the overall market structure, including impulse and correction phases, as well as weak and strong trends.
- 🔄 The video emphasizes the importance of experience in live markets to internalize trends and price action, making theoretical knowledge more practical.
- 📊 The speaker discusses how higher time frames can show one trend (bullish or bearish) while lower time frames may present different trends, highlighting the need for multi-timeframe analysis.
- 📉 In a weak bullish trend, retracements are more frequent, but as long as support holds, the trend remains bullish. Breaks in structure signal potential reversals.
- ⏳ Impulse phases are characterized by strong, fast-moving candles, while correction phases are slower with more fluctuation, representing a pullback in price.
- 🔍 The video touches on the concept of trends within trends, explaining how corrections on higher time frames can appear as trends in smaller time frames.
- 💡 Multi-time frame analysis is crucial for traders to understand the overall market direction and to avoid conflicting trades across different time frames.
- 🚫 Consolidation phases, where the market moves sideways, are less favorable for trading trends and should generally be avoided.
- 🔄 Reversals are key points where bullish or bearish trends transition, and understanding their characteristics helps traders adjust their strategies to avoid potential losses.
Q & A
What is the primary focus of the video?
-The primary focus of the video is to apply the theoretical concepts of market trends, structure, and price action to live charts, specifically using the Euro-JPY (EUR/JPY) on the daily time frame. The presenter emphasizes the importance of understanding trends in live markets and how to recognize bullish and bearish structures.
What is meant by a 'light bullish trend' in the video?
-A 'light bullish trend,' also referred to as a 'weak bullish trend,' is a bullish market structure where prices are creating higher highs and higher lows, but with frequent and heavy retracement phases. This indicates that while the market is still trending upwards, the momentum is not very strong, and corrections are more common.
How does the presenter recommend identifying market trends on live charts?
-The presenter recommends mapping out the market’s highs and lows on the chart to identify trends. This involves recognizing impulse and correction phases, and determining whether the market is in a bullish or bearish structure. He emphasizes practicing this by pausing the video to map highs and lows on the chart yourself.
What is the difference between an impulse and correction phase in market trends?
-The impulse phase refers to a strong, fast-moving price action that pushes the market in a specific direction (e.g., upwards in a bullish trend). The correction phase is a slower, more gradual retracement in the opposite direction, often characterized by choppy or rangy price movement. Impulse phases tend to have larger candles with more momentum, while correction phases have smaller, weaker candles.
What role do higher time frames play in multi-timeframe analysis?
-Higher time frames provide the overall direction and trend, which traders should align with when executing trades on lower time frames. For example, even though there may be a bearish trend on a 4-hour chart during a correction phase, the daily and weekly time frames may still show an overall bullish trend. Using higher time frames helps traders maintain a higher win rate by ensuring they trade in the direction of the dominant trend.
Why does the presenter stress the importance of understanding different time frames?
-The presenter stresses the importance of understanding different time frames because trends can vary depending on the time frame. A trend that appears bearish on a lower time frame might still be part of a correction phase in a larger bullish trend on a higher time frame. Understanding this prevents traders from making conflicting trades and helps them align their trading strategy with the broader market structure.
What are the characteristics of a strong bullish trend according to the video?
-A strong bullish trend is characterized by large, impulsive moves to the upside with minimal corrections. The price action features successive bullish candles with little retracement, indicating strong buying pressure. The corrections in such trends are small, and the market creates consistently higher highs and higher lows.
How does the market show signs of reversal from bullish to bearish trends?
-The market shows signs of reversal when the price action starts breaking key support levels and fails to create higher highs. The market begins to create lower highs and lower lows, signaling a transition from a bullish to a bearish trend. The presenter explains that understanding reversals helps traders shift their bias from buying to selling.
What is the importance of practicing market structure analysis?
-Practicing market structure analysis helps traders internalize the concepts of trend identification, impulse and correction phases, and reversals. The presenter emphasizes the need to repeatedly observe and analyze live price action to build experience and confidence in recognizing real-time market structures, which differ from theoretical examples.
Why should traders avoid consolidation phases according to the video?
-Traders should avoid consolidation phases because the market lacks a clear trend, making it difficult to identify quality setups and leading to choppy price action. The trading strategy of catching swing highs and lows is less effective in consolidation, so it's better to wait for trending market conditions before taking trades.
Outlines

This section is available to paid users only. Please upgrade to access this part.
Upgrade NowMindmap

This section is available to paid users only. Please upgrade to access this part.
Upgrade NowKeywords

This section is available to paid users only. Please upgrade to access this part.
Upgrade NowHighlights

This section is available to paid users only. Please upgrade to access this part.
Upgrade NowTranscripts

This section is available to paid users only. Please upgrade to access this part.
Upgrade NowBrowse More Related Video

Magic of "Market Structure Mapping" | Smart Money Concepts (SMC) Full Course🔥| Episode - 1
Trading Cepat dan Mudah dengan Market Structure (Detail)

PO3 + MMXM + SMT + STDV | ICT Concepts | DexterLab
Liquidity Run Or Liquidity Sweep ( Purge Or Bos )

Advanced Market Structure Course (step by step) SMC

ICT FOR DUMMIES | Market Structure EP. 3
5.0 / 5 (0 votes)