Advanced Market Structure Course (step by step) SMC
Summary
TLDRThis video script explores the concept of multi-dimensional market structure in trading, focusing on the interaction between different timeframes (15-minute and 4-hour charts). It discusses the process of identifying key market phases, such as changes in character (CHoCH) from bearish to bullish and vice versa, and using these shifts to make informed trading decisions. The script emphasizes the importance of mapping out trading ranges, recognizing supply and demand zones, and understanding break of structure (BoS) to capture high-probability entries. The goal is to teach traders how to interpret market movements and align their strategy with larger trends.
Takeaways
- 😀 Understand market structure by analyzing both internal (shorter timeframes) and external (longer timeframes) trends to make informed trading decisions.
- 😀 A change of character indicates a shift in market sentiment, such as from bearish to bullish or vice versa, signaling potential trade opportunities.
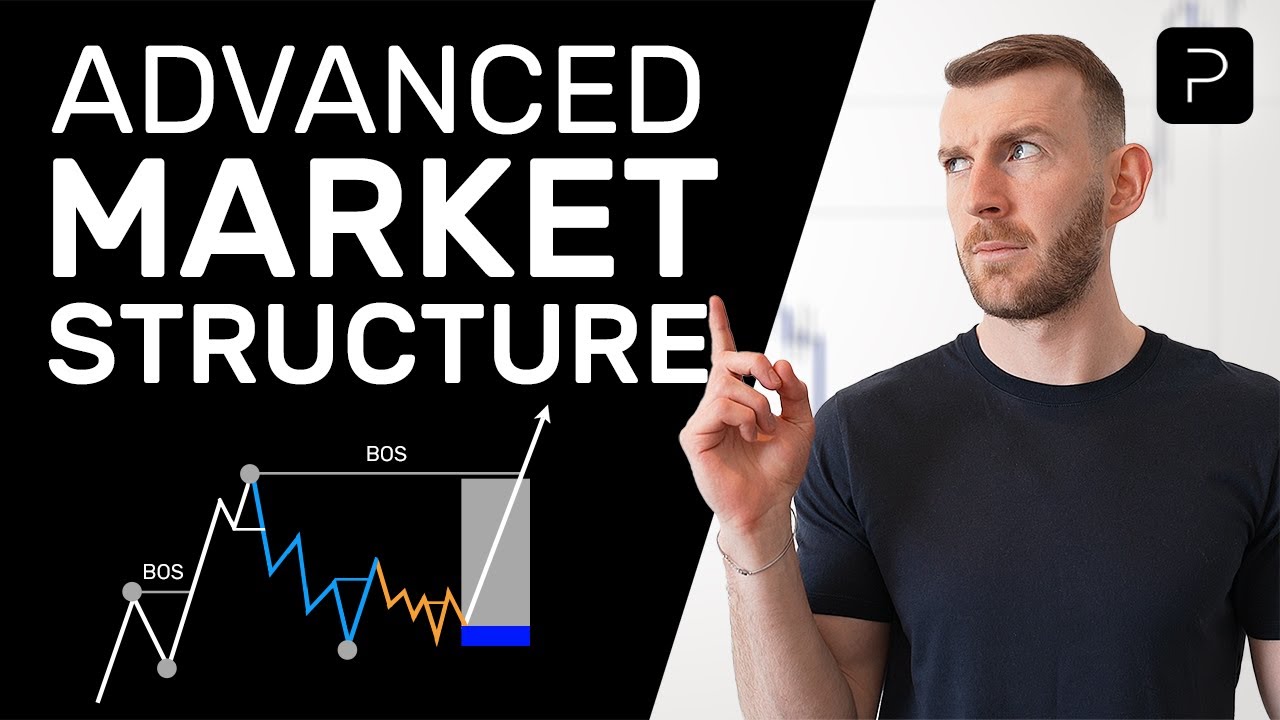
- 😀 Price action often moves in phases of higher highs, higher lows, and lower lows. Recognizing these patterns can help forecast price movement.
- 😀 Liquidity zones are areas where price ranges for extended periods due to either low liquidity or order accumulation, often leading to sharp moves when liquidity is released.
- 😀 Recognize when price is simply liquidating highs or lows versus when it is truly breaking structure. Liquidity events may not always signal a sustained trend change.
- 😀 Patience is crucial in trading. Wait for price action to confirm the market's intentions rather than prematurely entering trades based on assumptions.
- 😀 Mapping out the structural range on multiple timeframes (like 15-minute and 4-hour) helps identify potential reversal points and continuation patterns.
- 😀 A four-hour pullback followed by a realignment on smaller timeframes, like 15 minutes, helps identify when the market may resume its larger trend.
- 😀 Internal structure shifts (within smaller timeframes) can provide early insights into potential larger market movements, aiding in more precise entry points.
- 😀 Multi-dimensional market structure analysis allows you to see beyond the surface and identify when the market is likely to pull back, shift direction, or continue trending.
- 😀 Continuously track both the internal and external structures as price action evolves to adjust your trading approach, ensuring you're aligned with the broader market trend.
Q & A
What is the main concept of multi-dimensional market structure as explained in the script?
-The main concept of multi-dimensional market structure is understanding how price action behaves on different time frames (e.g., 15-minute vs. 4-hour charts) and how shifts in internal (shorter time frames) and external (longer time frames) structures impact trading decisions. This approach helps traders identify key points for entering and exiting the market based on price behavior.
What does 'Change of Character' (CoC) mean in trading?
-'Change of Character' (CoC) refers to a shift in the market's behavior, where the price action transitions from a bearish trend (lower lows and lower highs) to a bullish trend (higher highs and higher lows), or vice versa. This change typically signals a potential reversal or continuation of the market's direction.
How does the concept of 'liquidation' apply to price action in this context?
-In this context, 'liquidation' refers to price moving above or below a significant level (such as a high or low) to clear out orders and create liquidity. This often results in a sharp price move, either continuing in the direction of the trend or reversing, depending on whether it signals a trend continuation or a pullback.
Why is it important to observe both internal and external market structures?
-Observing both internal and external market structures is crucial because it helps traders understand the overall market trend (external structure) while identifying short-term fluctuations and entry points (internal structure). By combining these, traders can make more informed decisions on when to enter or exit the market.
What role do swing highs and swing lows play in identifying market trends?
-Swing highs and swing lows are key reference points for identifying market trends. A break of a swing high indicates a bullish trend, while a break of a swing low signals a bearish trend. These levels are used to determine whether the market is in a range or trending, and they help traders decide whether to enter or exit positions.
What does it mean when price 'liquidates' a high or low without breaking it?
-When price 'liquidates' a high or low without breaking it, it means price temporarily moves past the level, often through a wick or brief spike, to clear out stop losses or pending orders. However, the price doesn't sustain above or below that level, indicating a potential reversal or continuation in the opposite direction.
What is the significance of waiting for a pullback before entering a trade?
-Waiting for a pullback allows traders to avoid entering the market too early. It helps ensure that price has retraced to a favorable level, typically near demand or supply zones, which increases the likelihood of the trade moving in the desired direction. It also provides an opportunity to confirm the market's overall trend.
How can traders use the 15-minute time frame to confirm trades on a larger time frame like the 4-hour chart?
-Traders can use the 15-minute time frame to look for changes in character (CoC) and price action that confirm trends identified on the 4-hour chart. For example, if the 4-hour chart is bullish, traders can wait for the 15-minute chart to show a pullback and then look for signals that indicate a continuation of the uptrend before entering a trade.
What happens when the price breaks structure on both the internal and external time frames simultaneously?
-When the price breaks structure on both the internal (shorter time frame) and external (longer time frame) time frames simultaneously, it indicates strong confirmation that the market is either continuing or reversing in the identified direction. This is a high-probability scenario for traders to enter positions with greater confidence.
What should traders do when price is caught between areas of supply and demand?
-When price is caught between areas of supply and demand, traders should be patient and wait for the market to show its direction. They should not enter trades based on indecisive price moves and should instead look for a clear change of character, indicating whether the market will break in favor of demand or supply.
Outlines

This section is available to paid users only. Please upgrade to access this part.
Upgrade NowMindmap

This section is available to paid users only. Please upgrade to access this part.
Upgrade NowKeywords

This section is available to paid users only. Please upgrade to access this part.
Upgrade NowHighlights

This section is available to paid users only. Please upgrade to access this part.
Upgrade NowTranscripts

This section is available to paid users only. Please upgrade to access this part.
Upgrade NowBrowse More Related Video
How to Understand Multi-Timeframe Market Structure - MUST WATCH | SMC | FOREX [Part 2]

Aligning Time Frames Is What You Are MISSING
How To Use The ICT MMXM Model In 2024 (Refined)

It's Very Easy Top Down Analysis

SIMPLIFIED ICT PO3/AMD. HOW TO TRADE REAL DISTRIBUTION

Why you STILL don't UNDERSTAND ICT Market Maker Models
5.0 / 5 (0 votes)