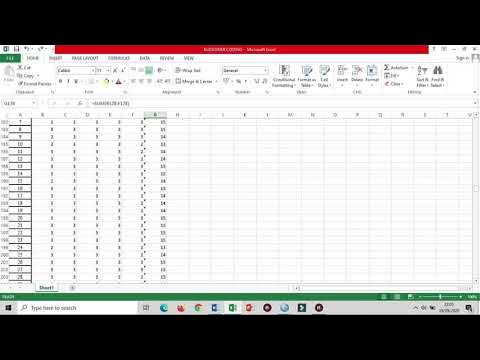
Using Google Sheets to Calculate Measures of Central Tendency

C Annable Math Page
15 Oct 201905:00

Summary

TLDRThis video tutorial offers a step-by-step guide on utilizing Google Sheets for calculating statistical measures such as mean, median, mode, and range. It simplifies the process by demonstrating how to set up formulas for quick calculations. The video illustrates inserting functions like 'average' and 'median' directly or by typing them into cells. It also covers sorting data to identify the mode and calculate the range, emphasizing the importance of performing this step last to avoid disrupting data relationships. The tutorial aims to enhance efficiency in data analysis using Google Sheets.

Takeaways

  • πŸ“Š Use Google Sheets to calculate statistical measures like mean, median, mode, and range with ease.
  • πŸ” Insert functions in Google Sheets by going to 'Insert' > 'Function' or by typing '=' and starting to type the function name.
  • πŸ“ˆ To find the mean, use the 'AVERAGE' function and select the range of cells you want to calculate the mean for.
  • πŸ“‹ Copy and paste the mean formula to other columns or sheets to quickly calculate additional means.
  • πŸ”’ For the median, use the 'MEDIAN' function and select the appropriate cells to find the middle value of the dataset.
  • πŸ“‘ After performing all necessary calculations, sort the data to identify the mode and range.
  • πŸ”ƒ Sorting data in Google Sheets can be done by highlighting the cells and using the 'Data' > 'Sort' option.
  • πŸ“‰ To calculate the range, sort the data first to arrange it from smallest to largest, then subtract the smallest value from the largest.
  • πŸ”‘ Remember to sort the data last after all calculations are complete to avoid disrupting the data's original order.
  • πŸ” The 'MODE' function can also be used to find the most frequently occurring number in a dataset.

Q & A

  • What is the main topic of the video?

    -The main topic of the video is teaching viewers how to use Google Sheets to calculate statistical measures such as mean, median, mode, and range.

  • How does the video suggest finding the mean in Google Sheets?

    -The video suggests inserting a formula for the mean by either going to 'Insert' then 'Function' and selecting 'Math' or 'Statistical', or by typing an equal sign followed by 'average' and selecting the range of cells to calculate the mean.

  • What keyboard shortcut is used to copy a formula in Google Sheets according to the video?

    -The video mentions using 'Ctrl C' to copy a formula in Google Sheets.

  • How can you apply the copied formula to other columns or sheets in Google Sheets?

    -After copying the formula with 'Ctrl C', you can paste it into other columns or sheets as needed by using the 'Paste' option or the 'Ctrl V' keyboard shortcut.

  • What is the recommended method for finding the median in the video?

    -The video recommends finding the median by inserting a formula or typing an equal sign followed by 'median' and then selecting the range of cells to calculate the median.

  • Why should sorting data be done at the end of data analysis in Google Sheets?

    -Sorting data should be done at the end of data analysis because it rearranges the data, which could disrupt any previously calculated relationships or associations between data points.

  • How does the video demonstrate sorting data in Google Sheets?

    -The video demonstrates sorting data by highlighting the numbers to be sorted, going to the 'Data' tab, and selecting 'Sort range' to sort the data in ascending order from smallest to largest.

  • What is the easiest way to calculate the mode according to the video?

    -The easiest way to calculate the mode, as per the video, is to sort the data and visually identify the most common number, or by using a formula that calculates the mode.

  • How can you calculate the range in Google Sheets after sorting the data?

    -After sorting the data, the range can be calculated by subtracting the smallest value from the largest value, or by using a formula that automatically calculates the difference between the maximum and minimum values in a given range.

  • What is the video's overall advice for using Google Sheets formulas?

    -The video advises using Google Sheets formulas to automate and expedite the process of calculating statistical measures, thus making the task easier and more efficient.

Outlines

00:00

πŸ“Š Google Sheets for Statistical Calculations

This video tutorial guides viewers on how to utilize Google Sheets for calculating statistical measures such as mean, median, mode, and range. It emphasizes the ease of setting up formulas to automate these calculations. The presenter suggests adding topic titles in the spreadsheet and demonstrates how to insert functions for calculating the mean by using the 'average' formula. The process involves selecting the range of cells to apply the formula and copying it to other columns for consistency. The video also covers calculating the median by either inserting a formula or typing 'median' after an equals sign, with a cautionary note to ensure data is correctly selected before applying the formula. The presenter advises sorting data to facilitate the calculation of mode and range, with a reminder to sort data last to avoid disrupting initial data relationships. The video concludes by encouraging viewers to use Google Sheets' formulas to streamline their work.

Mindmap

Keywords

πŸ’‘Google Sheets

Google Sheets is a web-based spreadsheet program that is part of Google's office suite. In the video, it is used to demonstrate how to calculate statistical measures like mean, median, mode, and range. The script shows viewers how to leverage the platform's functions to simplify data analysis tasks, making it easier to handle large sets of data without extensive manual calculations.

πŸ’‘Mean

Mean, also known as average, is a measure of central tendency that represents the sum of all values in a data set divided by the number of values. In the script, it is shown how to calculate the mean using a formula in Google Sheets, which is particularly useful for quickly summarizing data and understanding the central point of a dataset.

πŸ’‘Median

Median is another measure of central tendency that represents the middle value in a data set when the numbers are arranged in ascending order. The video script explains how to find the median using Google Sheets by either using the built-in function or by sorting the data and visually identifying the middle value.

πŸ’‘Mode

Mode is the value that appears most frequently in a data set. The script discusses how to identify the mode in Google Sheets, either by sorting the data to visually determine the most common value or by using a formula that calculates it directly. This is important for understanding the most typical or common occurrence within a dataset.

πŸ’‘Range

Range is the difference between the highest and lowest values in a data set, representing the spread or dispersion of the data. In the video, the script guides viewers on how to calculate the range by sorting the data in ascending order, which automatically arranges the values from smallest to largest, making it easy to identify the range.

πŸ’‘Formula

A formula in Google Sheets is a set of instructions that performs calculations on data. The script demonstrates how to insert formulas to calculate statistical measures like mean, median, and mode. Formulas are essential for automating calculations and ensuring accuracy and efficiency in data analysis.

πŸ’‘Insert Function

In Google Sheets, 'Insert Function' is an option that allows users to add pre-defined formulas for various calculations. The video script uses this feature to show how to easily add statistical functions to calculate mean, median, and other measures without having to manually type out the entire formula.

πŸ’‘Copy and Paste

Copy and paste is a common feature in spreadsheets that allows users to duplicate data or formulas across different cells or sheets. The script illustrates how to copy a calculated mean and paste it into other columns or sheets, streamlining the process of applying the same calculation to different sets of data.

πŸ’‘Sorting

Sorting data in Google Sheets is the process of arranging values in a specific order, either ascending or descending. The video script explains how to sort data to find the mode and range, which is crucial for understanding the distribution and variability of data.

πŸ’‘Data Analysis

Data analysis involves examining, cleaning, transforming, and modeling data to extract useful information, draw conclusions, or support decision-making. The video's theme revolves around data analysis, specifically using Google Sheets to calculate statistical measures, which is a fundamental part of understanding and interpreting data.

πŸ’‘Measures of Central Tendency

Measures of central tendency are statistical measures that describe the center or typical value of a dataset. The video focuses on calculating mean, median, and mode, which are all measures of central tendency. These measures help to summarize and understand the overall trend within a dataset.

Highlights

Introduction to using Google Sheets for statistical calculations like mean, median, mode, and range.

Efficient setup of formulas in Google Sheets to minimize manual work.

Adding topic titles in the spreadsheet for organization.

Using the 'Insert Function' feature to find the mean.

Accessing the 'Average' function through the 'Math' or 'Statistical' categories.

Autocomplete feature for typing 'average' to quickly access the formula.

Dragging cells to apply the average formula across a range.

Copying and pasting the average formula to other columns for consistency.

Finding the mean for specific columns like 'hi' using the same method.

Copying the calculated mean to other sheets for further analysis.

Inserting the median formula or using the equals sign to type 'median'.

Selecting the range of values for the median calculation.

Copying the median formula to other columns for a comprehensive analysis.

Sorting data as a prerequisite for calculating mode and range.

Highlighting and sorting data in ascending order for mode and range calculations.

Caution advised on sorting data to avoid disrupting the dataset before calculations.

Manually identifying the mode by observing the most frequent number after sorting.

Using the 'Mode' formula for an automated calculation of the mode.

Advantages of using Google Sheets formulas for efficiency in statistical analysis.

Transcripts

play00:01

so in this video I'm gonna go through

play00:04

how to use Google sheets to calculate

play00:07

things like mean median mode and range

play00:09

and to make it really quick and easy on

play00:12

yourself so that you don't have to do a

play00:14

lot of work you can pretty much just set

play00:17

up formulas so for example what you

play00:19

could do in your spreadsheet is add

play00:23

topic titles like mean and median um one

play00:31

of the easiest ways to find a mean is to

play00:35

just insert a formula so you can go

play00:37

insert function and we can go to math or

play00:40

we can go to statistical and and you're

play00:44

not that I mean that you will find

play00:46

average the other thing that you can do

play00:48

is if you put an equal sign in the box

play00:51

and then start typing so you can already

play00:54

see if you start typing the word average

play00:55

it will come up and we just want a

play00:58

normal average and then all you have to

play01:00

do is drag the cells that you want to

play01:03

find the average so for example we're

play01:05

gonna go from here all the way to here

play01:07

and it will send the formula for you and

play01:09

all you have to do is close the bracket

play01:11

and then when you hit enter your mean or

play01:15

your average will already automatically

play01:17

be populated and you can also copy that

play01:21

so hit ctrl C to copy and you can paste

play01:24

it into the other columns now I know

play01:27

that you don't have to do it for all of

play01:29

the columns but you could paste it into

play01:31

as many columns as you want and you can

play01:34

be pasting that into all of your other

play01:37

sheets as well so for example if we

play01:39

wanted to find the mean on the hi column

play01:43

for everyone again we we could type in

play01:46

the word mean so that we remember what

play01:48

it is in this box we could go insert and

play01:51

then math or insert statistical and you

play01:55

will see average or you can hit the

play01:57

equal sign and start doing it and so

play02:00

here what you want to do again find the

play02:03

first one and scroll all the way to the

play02:06

last one and hit enter and then there is

play02:09

your average for everyone in the grade

play02:11

and again you can copy that

play02:13

and paste it into the other columns to

play02:17

find the other averages if you would

play02:20

like to so likewise for median same

play02:25

thing we could go insert and a formula

play02:28

or if we hit equals and just typing the

play02:31

word median we will see it and then we

play02:34

can just scroll for the values that we

play02:38

want

play02:38

oh sorry something went wrong here so

play02:41

again equals start typing median and you

play02:44

can select that it's actually now gonna

play02:46

suggest the values that you want so

play02:49

double check that that's correct and if

play02:51

you've got that hit enter and then again

play02:53

you can just copy and paste that into

play02:56

the other columns as you would like them

play02:59

to be able to get your mode and your

play03:05

range the easiest thing to do is to sort

play03:07

the data and to sort the data what you

play03:12

can do is highlight all of the numbers

play03:14

that you want to sort and if you go to

play03:17

the column two tab at the top data you

play03:20

can sort in different ways and so one of

play03:22

the ways that we're gonna do is we're

play03:23

gonna sort the range it's a it's this is

play03:27

telling us sort the range in column B

play03:29

from A to Z and eight to said means in

play03:31

alphabetical order or in this case

play03:33

because it's not letters it's going to

play03:36

sort them in numerical order from

play03:39

smallest biggest if I click that I've

play03:41

now sorted the data now make sure that

play03:44

you don't do this step until you've used

play03:47

the data any way that you want because

play03:49

what its gonna do it's gonna change the

play03:51

data around so again we're gonna

play03:53

highlight and we're gonna sort that so

play03:58

it's gonna change the information and

play04:00

change so we had a particular person's

play04:02

height was matched with their arm span

play04:04

that's now changed so make sure you're

play04:06

not doing this till the end but what you

play04:09

can see now is you can see this also and

play04:11

you calculate by subtracting in your

play04:15

head or on your calculator you can also

play04:17

quickly glance and see the mode um I

play04:20

also believe I think you can also

play04:26

find the mode if you get equals and type

play04:29

the word mode and then again select so

play04:33

the mode you can use a formula for if

play04:36

you want and so there's the mode right

play04:38

there or you can just sort it and look

play04:40

at the most common number but sorting

play04:43

will be very useful when you're trying

play04:45

to calculate the range because it

play04:46

automatically will sort from the

play04:48

smallest to the biggest so use the

play04:51

Google sheets formulas to your advantage

play04:52

to make things a lot faster for yourself

play04:54

in terms of making the calculations for

play04:57

the measures of central tendency

Rate This
β˜…
β˜…
β˜…
β˜…
β˜…

5.0 / 5 (0 votes)

Related Tags
Google SheetsStatistical AnalysisData CalculationMean CalculationMedian FinderMode IdentificationRange DeterminationEfficiency TipsSpreadsheet TutorialData SortingFormula Usage