cara mencari mean, median dan mode dari awal kuesioner, tabulasi dan menggunakan spss sampai hasil
Summary
TLDRThis tutorial provides a step-by-step guide on calculating mean, median, and mode using Excel and SPSS. The example focuses on analyzing the independence of elderly individuals, with observations recorded and scored. The script shows how to convert observational data into numerical values, input them into Excel, and then transfer the data to SPSS for analysis. The process includes calculating descriptive statistics such as mean, median, and mode to derive insights. The tutorial is designed to assist students or researchers conducting similar studies or preparing for thesis projects.
Takeaways
- 😀 The video focuses on calculating mean, median, and mode to help with research or thesis work, specifically for studies on elderly independence.
- 😀 The example used in the video involves observation data on elderly individuals' independence, with various stages of mobility like 'independent,' 'assisted,' and 'unable.'
- 😀 Observations are recorded using a checklist where the highest positive answer, 'independent,' is given the highest score in the analysis.
- 😀 Scores from each observation are added up for each sample, and Excel is used for easy summation and organization of the data.
- 😀 Data is then transferred to SPSS for further analysis, where it can be visualized and analyzed for patterns.
- 😀 The variable 'independence' is set up in SPSS, with the label 'kemandirian lansia' for elderly independence, ensuring clarity and organization of data.
- 😀 Data is pasted into SPSS from Excel, where it is formatted for analysis across all samples (in this case, 82 samples).
- 😀 In SPSS, descriptive statistics, such as mean, median, and mode, are chosen for analysis, focusing on how often certain values appear in the data.
- 😀 The script explains the differences between mean (average), median (middle value), and mode (most frequent value), with practical examples from the data.
- 😀 The output from SPSS shows that the minimum score is 14.3, the median score is 14, and the mode is 15, helping to interpret the data effectively.
- 😀 The video ends with a note encouraging viewers to provide feedback, comments, or suggestions to improve the tutorial.
Q & A
What is the main purpose of the tutorial in the script?
-The main purpose of the tutorial is to teach how to calculate the mean, median, and mode using SPSS and Excel based on observation data related to elderly independence.
How is the data for the elderly independence observation presented in the tutorial?
-The data for elderly independence is presented in the form of observation checklists with responses such as 'independent', 'assisted by others', and 'unable'. These responses are then scored based on their positivity.
What software is mentioned in the tutorial for processing data?
-The tutorial mentions using Excel and SPSS for processing and analyzing the data.
What is the significance of scoring the observations in the tutorial?
-Scoring the observations is significant because it allows the researcher to assign numerical values to responses, making it easier to calculate statistical measures like mean, median, and mode.
What statistical measures are calculated in the tutorial?
-The tutorial calculates the mean, median, and mode, which represent the average, middle value, and most frequent value of the data, respectively.
Why is Excel used before SPSS in the tutorial?
-Excel is used first because it allows for easier calculation of total scores for each sample, and it simplifies data entry before transferring it into SPSS for further analysis.
How is the data transferred from Excel to SPSS in the tutorial?
-The data is copied from Excel and pasted into SPSS under the 'Data View' section, ensuring that the dataset is ready for analysis.
What is the role of the 'Variable View' in SPSS as explained in the tutorial?
-In 'Variable View' on SPSS, the user defines the variables, such as 'independence', by naming and labeling them for proper identification during data analysis.
What is the significance of selecting 'Descriptive Statistics' in SPSS?
-Selecting 'Descriptive Statistics' in SPSS is important for calculating measures like mean, median, and mode, which provide insights into the central tendency of the data.
What is the final result presented in the tutorial after performing the statistical analysis?
-The final result shows the calculated mean, median, and mode for the dataset, with the mode indicating the most frequent score observed in the sample.
Outlines

This section is available to paid users only. Please upgrade to access this part.
Upgrade NowMindmap

This section is available to paid users only. Please upgrade to access this part.
Upgrade NowKeywords

This section is available to paid users only. Please upgrade to access this part.
Upgrade NowHighlights

This section is available to paid users only. Please upgrade to access this part.
Upgrade NowTranscripts

This section is available to paid users only. Please upgrade to access this part.
Upgrade NowBrowse More Related Video

Measure of Central Tendency of Grouped Data for beginners
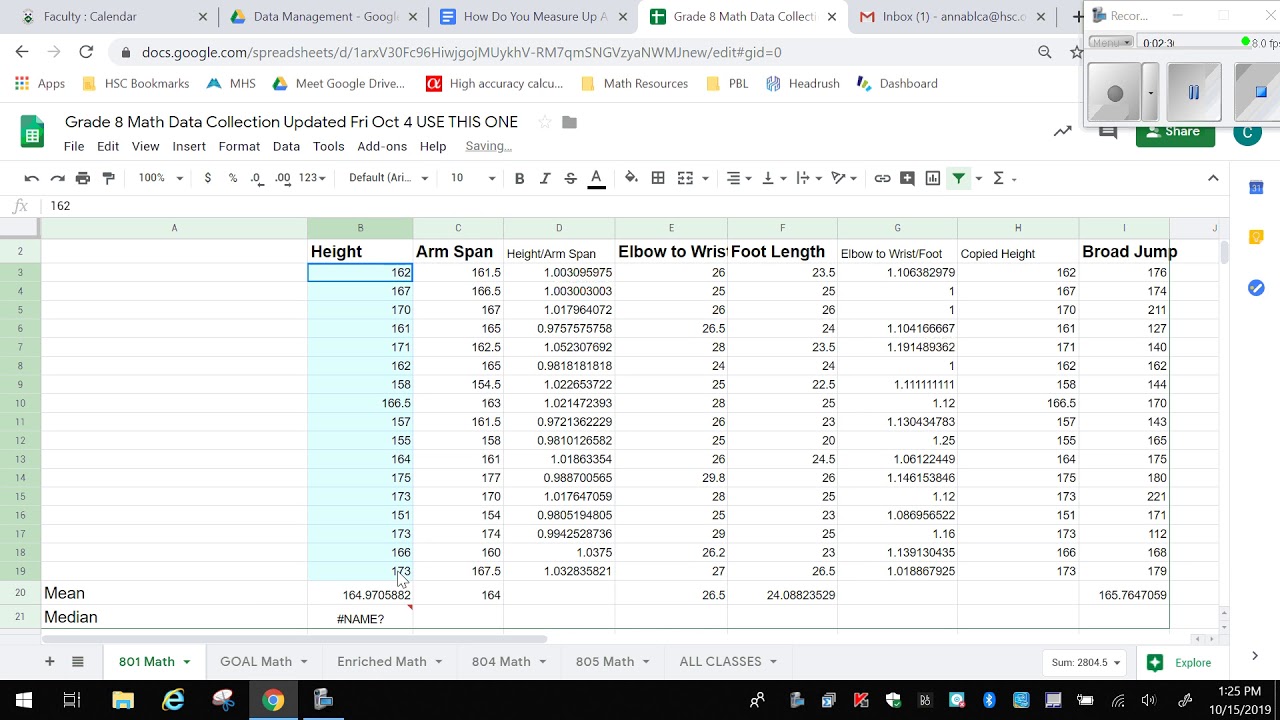
Using Google Sheets to Calculate Measures of Central Tendency
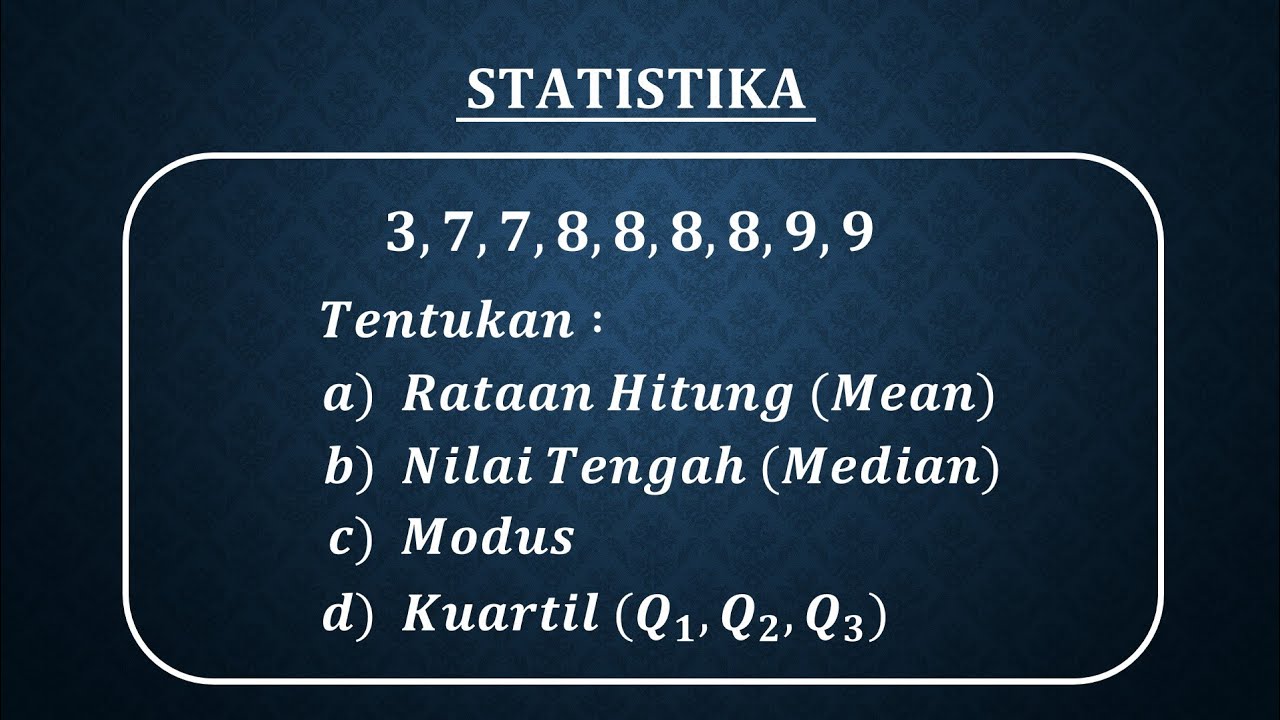
STATISTIKA Tentang Mean, Median, Modus dan Kuartil Data Tunggal

Mean, Median, and Mode of Grouped Data & Frequency Distribution Tables Statistics

Cara menyusun tabel distribusi frekuensi, menentukan mean, median dan modus data kelompok
Statistika - Ukuran Pemusatan Data (Mean, Median, Modus)
5.0 / 5 (0 votes)