79% of Regression Analysis Basics in under 18 Minutes [Simple, Multiple and Logistic Regression]
Summary
TLDRThis video script offers an entertaining dive into the world of regression analysis, explaining simple linear, multiple, and logistic regression. It uses relatable examples like ice cream sales and bakery profits to illustrate how these statistical methods help predict outcomes and understand data. The script promises to make complex statistical concepts accessible and engaging, ensuring viewers can apply these tools in real-world scenarios.
Takeaways
- 📊 Simple linear regression is the foundational model for understanding relationships between variables, often used to predict outcomes based on a single predictor.
- 📈 The line in simple linear regression is not randomly drawn but calculated to minimize the distance between itself and all data points, providing a best fit.
- 🧠 The equation of the line in regression (y = b0 + b1*x) is crucial as it represents the relationship between the dependent variable (y) and the independent variable (x), with b0 being the y-intercept and b1 the slope.
- 🍦 An example used in the script is ice cream sales, where temperature (independent variable) affects the number of scoops sold (dependent variable), illustrating the practical application of simple linear regression.
- 🔢 Multiple linear regression expands on simple linear regression by incorporating multiple predictors, allowing for a more comprehensive analysis of how various factors influence an outcome.
- 📉 Multiple linear regression uses a hyperplane in multi-dimensional space to model the relationship between multiple predictors and a single response variable.
- 📊 The coefficients obtained from multiple regression analysis indicate the influence of each predictor on the outcome, helping to understand the impact of different variables.
- 🔮 Logistic regression is used for binary outcomes, estimating probabilities to categorize outcomes into one of two groups, such as pass/fail or yes/no.
- 📊 The sigmoid function in logistic regression ensures that the output is a probability, ranging from 0 to 1, making it suitable for predicting binary outcomes.
- 👨💻 Real-world applications of regression models include predicting sales in business, diagnosing diseases in healthcare, and understanding complex data patterns across various fields.
Q & A
What is simple linear regression and why is it considered the 'vanilla ice cream' of regression models?
-Simple linear regression is a statistical method that models the relationship between two variables by fitting a straight line through the data points. It is considered the 'vanilla ice cream' of regression models because it is fundamental, reliable, and a perfect starting point for understanding more complex regression techniques.
How does simple linear regression help in predicting outcomes like ice cream sales based on temperature?
-Simple linear regression helps in predicting outcomes by finding the best straight line that fits the data points, which minimizes the distance between the line and all data points. In the case of ice cream sales, it provides an estimate of sales based on temperature by identifying the relationship between the two variables.
What are the components of the simple linear regression equation and what do they represent?
-The simple linear regression equation is Y = B0 + B1X, where Y is the dependent variable (predicted value), X is the independent variable (predictor), B0 is the y-intercept (the value of Y when X is zero), and B1 is the slope (the change in Y for a one-unit change in X).
How does multiple linear regression differ from simple linear regression?
-Multiple linear regression differs from simple linear regression by considering multiple independent variables (predictors) instead of just one. It models the relationship between the dependent variable and two or more independent variables by finding the best hyperplane that fits the data in multidimensional space.
What is the purpose of the coefficients in a multiple linear regression equation?
-The coefficients in a multiple linear regression equation represent the influence of each independent variable on the dependent variable. They indicate how much the dependent variable is expected to change for a one-unit change in each independent variable, holding all other variables constant.
Can you explain the concept of logistic regression and its primary use case?
-Logistic regression is a statistical method used for predicting binary outcomes, such as yes/no or pass/fail. It estimates the probability of the outcome falling into one of two categories using an S-shaped curve called the sigmoid function. The primary use case is for classification problems where the outcome variable is categorical.
Why is the logistic function used in logistic regression instead of a straight line?
-The logistic function is used in logistic regression because it outputs values that range between zero and one, which is suitable for estimating probabilities. Unlike a straight line, which can produce values beyond this range, the logistic function ensures that the predicted probabilities remain within the valid range of 0 to 1.
What are some real-world applications of regression analysis mentioned in the script?
-Some real-world applications of regression analysis mentioned in the script include predicting sales based on advertising budget, understanding the combined effect of multiple factors like pricing and competitor actions on sales, and predicting health outcomes such as whether a patient has a certain disease based on symptoms and test results.
What are the assumptions that regression models come with, and why are they important?
-Regression models come with assumptions such as linearity, independence, and homoscedasticity. These assumptions are important because they ensure the validity of the model's predictions. Ignoring these assumptions can lead to inaccurate or misleading results, similar to not following instructions properly.
How can one use regression analysis to estimate the number of ice cream scoops sold based on temperature and other factors?
-One can use regression analysis to estimate the number of ice cream scoops sold by collecting data on sales, temperature, and other influencing factors. By running a regression model with these variables, the analysis will provide coefficients that can be used to predict sales based on the given conditions.
Outlines

This section is available to paid users only. Please upgrade to access this part.
Upgrade NowMindmap

This section is available to paid users only. Please upgrade to access this part.
Upgrade NowKeywords

This section is available to paid users only. Please upgrade to access this part.
Upgrade NowHighlights

This section is available to paid users only. Please upgrade to access this part.
Upgrade NowTranscripts

This section is available to paid users only. Please upgrade to access this part.
Upgrade NowBrowse More Related Video

Data Mining 10 - Estimation (Linear Regression)

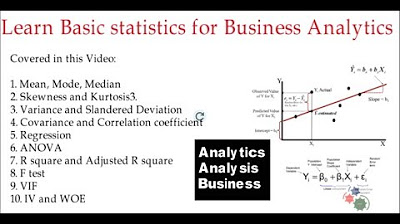
Learn Basic statistics for Business Analytics

PERBEDAAN REGRESI LINEAR SEDERHANA DAN REGRESI BERGANDA

Konsep Dasar Regresi Logistik

3. Learning untuk Klasifikasi dari MACHINE LEARNING

PERBEDAAN UJI REGRESI LOGISTIK DAN UJI REGRESI LINEAR | PENJELASAN MUDAH DIPAHAMI MAHASISWA
5.0 / 5 (0 votes)