PERBEDAAN UJI REGRESI LOGISTIK DAN UJI REGRESI LINEAR | PENJELASAN MUDAH DIPAHAMI MAHASISWA
Summary
TLDRThis video explains the differences between logistic regression and linear regression tests, both key statistical methods. It highlights how regression tests are used to analyze relationships between variables, with logistic regression focusing on categorical variables and linear regression analyzing numeric variables. The video covers the purpose of these tests, such as revealing p-values, risk magnitudes, and confidence intervals in logistic regression, and predicting increases or decreases in numeric values in linear regression. The concepts are illustrated through practical examples, making complex statistical methods easier to understand.
Takeaways
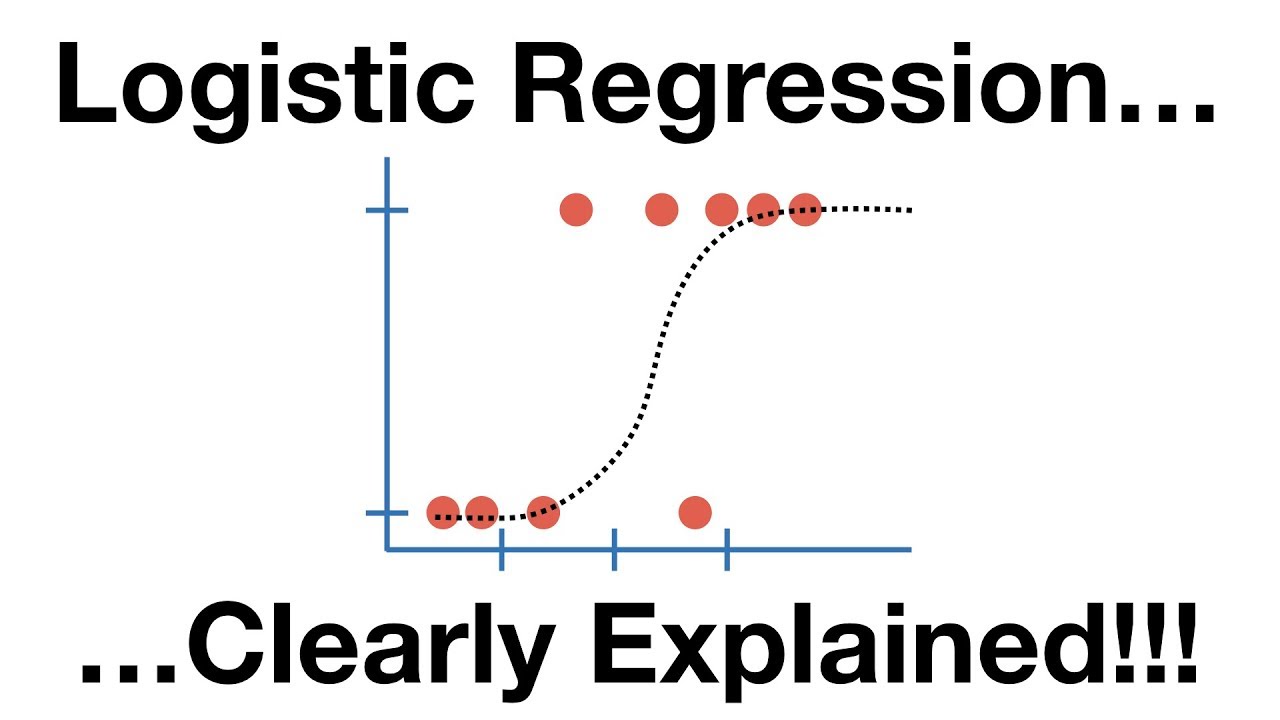
- 😀 Logistic regression is used to analyze categorical dependent variables, while linear regression is used for numeric dependent variables.
- 😀 Regression tests help to analyze the relationship between variables by adjusting for confounding variables, giving adjusted results.
- 😀 Bivariate tests provide rough results, without accounting for other variables, whereas regression tests give adjusted results after considering confounders.
- 😀 In logistic regression, the dependent variable must be categorical, while the independent variable can be either categorical or numeric, as long as numeric variables do not dominate.
- 😀 Logistic regression reveals three main things: p-value (relationship between variables), risk magnitude (e.g., the risk of a condition like coronary heart disease), and confidence interval (indicating the strength or absence of relationships).
- 😀 The confidence interval in logistic regression helps to interpret the relationship, with values above 1 indicating risk, below 1 indicating protection, and crossing 1 showing no relationship.
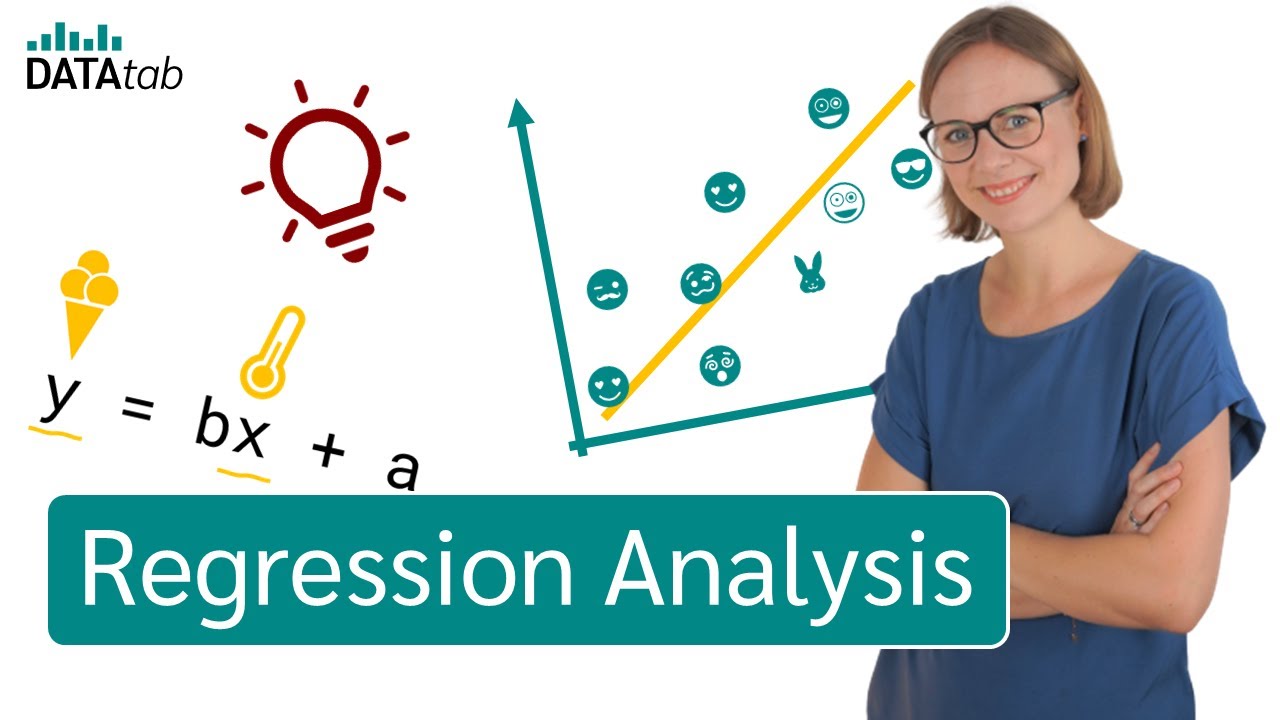
- 😀 Linear regression analyzes relationships between numeric variables, where both the dependent and independent variables must be numeric.
- 😀 Linear regression can predict the change in the dependent variable as a result of changes in the independent variables (e.g., predicting how study time affects GPA).
- 😀 Linear regression can predict future values by estimating the impact of independent variables on a dependent variable at specific levels (e.g., predicting cholesterol levels based on age).
- 😀 In regression analysis, the choice of test (logistic or linear) depends on the scale of the data: categorical data uses logistic regression, while numeric data uses linear regression.
Q & A
What is the main purpose of regression analysis?
-The main purpose of regression analysis is to explore the relationship between several variables and obtain real (adjusted) results by considering other confounding or disturbing variables.
What is the difference between 'gross' and 'adjusted' results in regression analysis?
-'Gross' results come from bivariate tests and do not account for the influence of other variables, whereas 'adjusted' results come from multivariate regression tests, which consider these additional variables.
What are the two main types of regression tests mentioned in the video?
-The two main types of regression tests discussed are logistic regression and linear regression.
What is the key feature of logistic regression?
-The key feature of logistic regression is that the dependent variable must be categorical, meaning it represents distinct categories, such as yes/no or success/failure.
What kind of variables can be used in logistic regression for independent variables?
-In logistic regression, the independent variables can be either categorical or numeric, although numeric variables should not dominate the model.
What three key outputs can be derived from logistic regression analysis?
-From logistic regression, you can derive the p-value (to check relationships), the risk magnitude (to assess the actual risk), and the confidence interval (to examine the precision and significance of the relationship).
How do confidence intervals help in interpreting logistic regression results?
-Confidence intervals in logistic regression indicate the range within which the true value of the relationship is likely to fall. If the range is above 1, it suggests a risk relationship; below 1 indicates a protective relationship, and crossing 1 indicates no significant relationship.
How does linear regression differ from logistic regression in terms of the data used?
-Linear regression is used when both the dependent and independent variables are numeric, aiming to predict continuous values, while logistic regression is used for categorical outcomes with a categorical dependent variable.
What is the primary purpose of linear regression analysis?
-The primary purpose of linear regression is to explore the relationship between numeric variables, allowing predictions of how changes in independent variables affect the dependent variable.
Can linear regression be used to predict future values?
-Yes, linear regression can predict future values of a dependent variable based on the relationship with independent variables, such as forecasting cholesterol levels at a certain age.
Outlines

This section is available to paid users only. Please upgrade to access this part.
Upgrade NowMindmap

This section is available to paid users only. Please upgrade to access this part.
Upgrade NowKeywords

This section is available to paid users only. Please upgrade to access this part.
Upgrade NowHighlights

This section is available to paid users only. Please upgrade to access this part.
Upgrade NowTranscripts

This section is available to paid users only. Please upgrade to access this part.
Upgrade NowBrowse More Related Video

Konsep Dasar Regresi Logistik

Modul 12 (StatSos2) - Konsep Dasar Regresi Linear Sederhana
StatQuest: Logistic Regression

KONSEP DASAR UJI REGRESI (LOGISTIK DAN LINEAR)

Lec-5: Logistic Regression with Simplest & Easiest Example | Machine Learning
79% of Regression Analysis Basics in under 18 Minutes [Simple, Multiple and Logistic Regression]
5.0 / 5 (0 votes)