Central Limit Theorem & Sampling Distribution Concepts | Statistics Tutorial | MarinStatsLectures
Summary
TLDRThis video explores the concept of the sampling distribution, particularly the sampling distribution of the mean. It explains how knowing the true mean of a population can help predict the likelihood of certain sample means appearing when collecting data. The video uses the example of systolic blood pressure to illustrate how repeated sampling of 25 observations can lead to a normal distribution of sample means around the true mean. It introduces the central limit theorem and discusses the standard error of the mean, which indicates how closely sample means are likely to approximate the true mean. The video concludes by emphasizing the importance of these concepts for statistical inference, including constructing confidence intervals and hypothesis tests.
Takeaways
- 📊 **Sampling Distribution Concept**: The video introduces the concept of a sampling distribution, focusing on the distribution of sample means.
- 🔍 **Understanding Population Truth**: It discusses how knowing the true mean and standard deviation of a population can help predict sample means.
- 🌐 **Central Limit Theorem**: Explains the central limit theorem, which states that the sampling distribution of the mean will be normal if samples are large or the population distribution is normal.
- 📐 **Standard Error of the Mean**: Introduces the standard error of the mean, which is the standard deviation of the sample mean.
- 🔢 **Calculating Standard Error**: Shows how to calculate the standard error as the population standard deviation divided by the square root of the sample size.
- 🎯 **Expectation of Sample Mean**: Emphasizes that while we expect the sample mean to equal the true mean, it will vary.
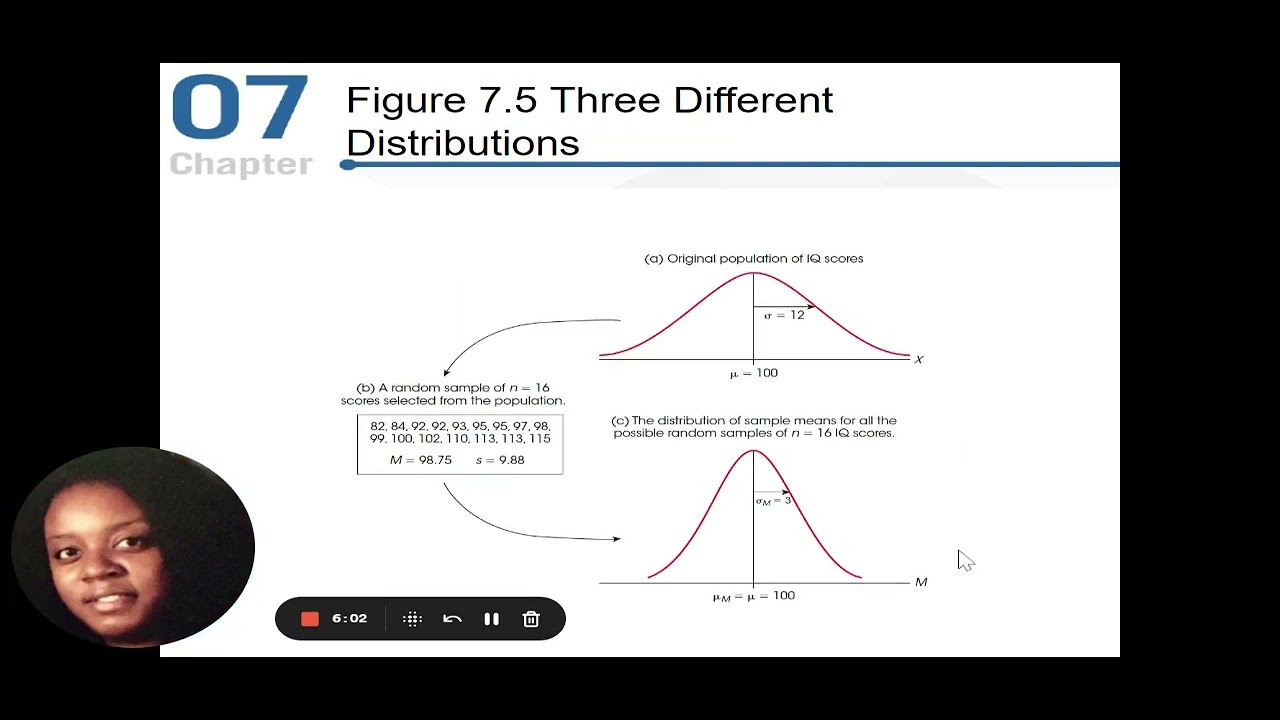
- 📉 **Distribution of Sample Means**: Highlights that the distribution of sample means is centered around the true mean and is approximately bell-shaped.
- 📈 **Impact of Sample Size**: Notes that as sample size increases, the standard error decreases, making estimates more precise.
- 🔄 **Repeated Sampling**: Suggests imagining taking multiple samples to understand the variability in sample means.
- 🔗 **Interactive Learning**: Encourages viewers to use web visualizations for a more interactive understanding of sampling distributions.
- 📚 **Application in Statistics**: Mentions that understanding sampling distributions is crucial for statistical inference, including confidence intervals and hypothesis testing.
Q & A
What is a sampling distribution?
-A sampling distribution is the theoretical set of all possible estimates or sample means that could be obtained from a population by taking many samples of a given size.
Why is understanding the sampling distribution important?
-Understanding the sampling distribution is crucial for statistical inference, as it allows us to make statements about a population based on a sample and to estimate how likely certain sample means are to occur.
What is the central limit theorem and how does it relate to sampling distribution?
-The central limit theorem states that if samples are independent and the sample size is large enough, or the population distribution is approximately normal, then the sampling distribution of the sample mean will be approximately normal.
What is the true mean and standard deviation of the systolic blood pressure in the example given?
-In the example provided, the true mean of the systolic blood pressure is 125, and the true standard deviation is 20.
What is the sample size used in the example?
-The sample size used in the example is 25 observations.
What is the standard error of the mean and how is it calculated?
-The standard error of the mean is the standard deviation of all possible sample means and is calculated as the standard deviation of the individual observations divided by the square root of the sample size (20 / √25 = 4 in the example).
How does the standard error help in understanding the sampling distribution?
-The standard error provides an idea of how far, on average, the sample mean will deviate from the true mean, indicating how close our estimates are likely to be to the true value.
What happens to the standard error as the sample size increases?
-As the sample size increases, the standard error decreases, meaning that our estimates become closer to the true values as we take more data.
What is the significance of the sample mean being approximately normally distributed?
-The fact that the sample mean is approximately normally distributed allows us to use the properties of the normal distribution to make inferences about the population mean, such as constructing confidence intervals and conducting hypothesis tests.
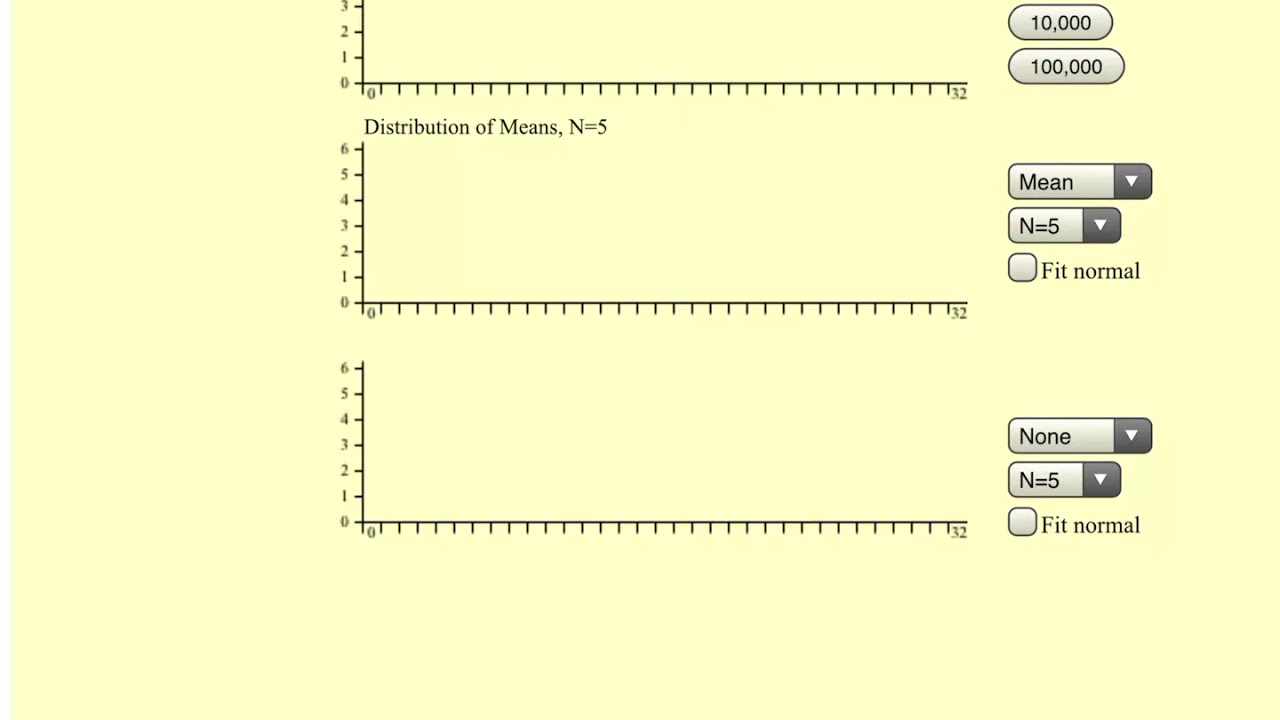
How can the concept of the sampling distribution be explored interactively?
-The concept of the sampling distribution can be explored interactively through web visualizations, as mentioned in the script, where one can simulate taking multiple samples and observe the resulting distributions.
What are the practical applications of understanding the sampling distribution in statistics?
-Understanding the sampling distribution is essential for statistical inference, including building confidence intervals and conducting hypothesis tests, which help in making informed decisions based on sample data.
Outlines

このセクションは有料ユーザー限定です。 アクセスするには、アップグレードをお願いします。
今すぐアップグレードMindmap

このセクションは有料ユーザー限定です。 アクセスするには、アップグレードをお願いします。
今すぐアップグレードKeywords

このセクションは有料ユーザー限定です。 アクセスするには、アップグレードをお願いします。
今すぐアップグレードHighlights

このセクションは有料ユーザー限定です。 アクセスするには、アップグレードをお願いします。
今すぐアップグレードTranscripts

このセクションは有料ユーザー限定です。 アクセスするには、アップグレードをお願いします。
今すぐアップグレード関連動画をさらに表示
Sampling Distributions: Introduction to the Concept

Sampling Distributions (7.2)
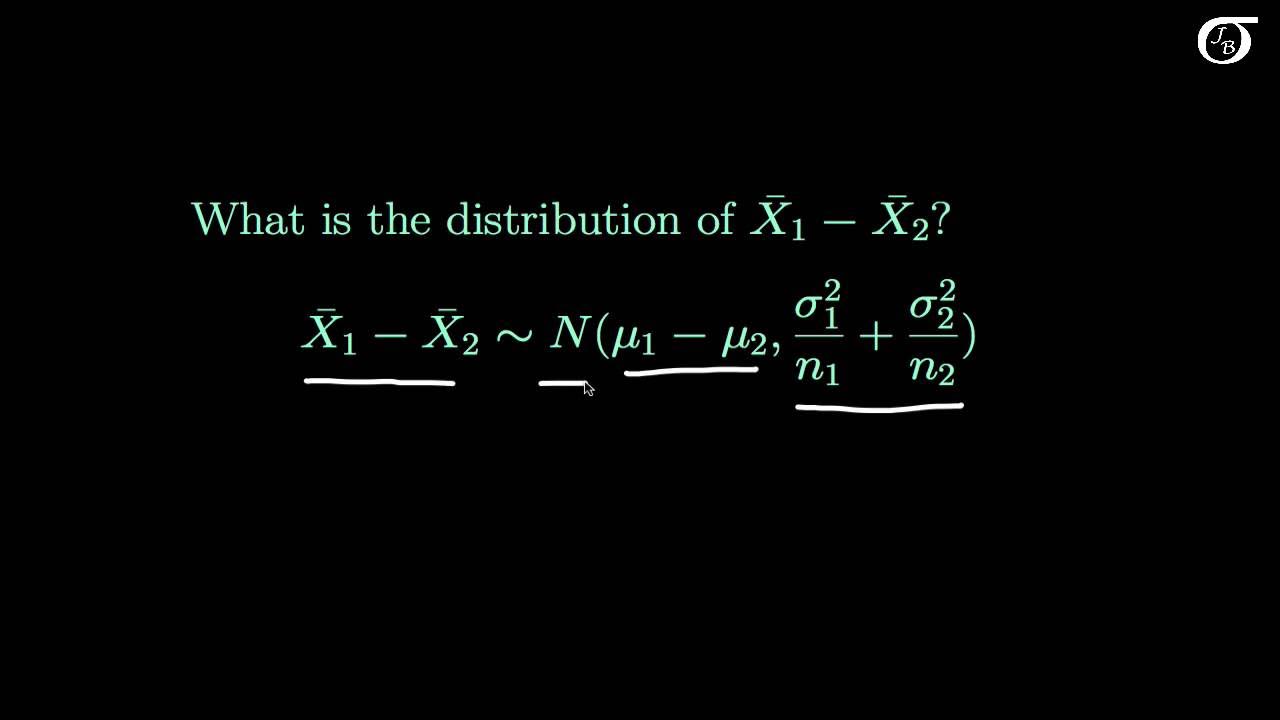
The Sampling Distribution of the Difference in Sample Means (X_1 bar - X_2 bar)

What is a Sampling Distribution? | Puppet Master of Statistics
Supplemental: Introduction to Sampling Dsitributions
Chapter 7 Probability and Samples The Distribution of Sample Means
5.0 / 5 (0 votes)
