Chapter 7 Probability and Samples The Distribution of Sample Means
Summary
TLDRThis chapter delves into probability, sampling, and the distribution of sample means, expanding on earlier discussions of populations and samples. It explores the concept of z-scores for sample means and introduces the Central Limit Theorem, which explains the shape, variability, and central tendency of sample mean distributions. The chapter also addresses sampling error, standard error, and how sample size influences the accuracy of estimates. Key concepts such as the Law of Large Numbers and standard error are explored, with examples demonstrating the relationship between sample size and variability. The content also discusses inferential statistics and the impact of sampling error on generalizations about populations.
Takeaways
- 😀 The location of a score in a sample or population can be represented by a z-score, helping to understand the relationship between sample data and the population.
- 😀 Samples provide an estimate of the population, and researchers generally prefer studying samples rather than a single score to make broader inferences about the population.
- 😀 Sampling error occurs when there is an incomplete or inaccurate representation of the population, and it reflects the natural discrepancies between sample statistics and population parameters.
- 😀 The distribution of sample means is nearly always normal in shape, and the larger the sample size, the closer the sample means will be to the population mean.
- 😀 The central limit theorem states that as the sample size increases, the distribution of sample means approaches a normal distribution, regardless of the population's shape.
- 😀 The expected value (M) of the distribution of sample means is equal to the population mean, and the standard error of the mean quantifies how well an individual sample mean represents the population.
- 😀 The Law of Large Numbers suggests that larger sample sizes increase the likelihood that the sample mean will be close to the population mean, making the sample more representative.
- 😀 As sample size increases, the standard error of the mean decreases, which means there is less error between the sample mean and the population mean.
- 😀 Z-scores are used to calculate the probability of selecting a sample with a specific mean, and a z-score tells you how far a sample mean is from the population mean in terms of standard deviations.
- 😀 The distribution of sample means can be visualized as a normal curve, and as sample size increases, the variability in the sample means decreases.
- 😀 Inferential statistics help researchers draw general conclusions about populations based on sample data, acknowledging that sampling error and variability are inherent in the process.
Q & A
What is the primary difference between a sample and a population?
-A sample is a subset of a population, and researchers use samples to make inferences about the larger population. Samples help estimate population parameters, but they may be affected by sampling error.
How does sampling error occur?
-Sampling error occurs when there is a natural discrepancy between a sample statistic and its corresponding population parameter. It is caused by variability in the selection of the sample and does not indicate a mistake.
What does the Central Limit Theorem describe?
-The Central Limit Theorem states that the distribution of sample means will approach a normal distribution as the sample size increases, regardless of the population's shape, provided the sample size is sufficiently large (typically n ≥ 30).
What is the expected value in the distribution of sample means?
-The expected value of the distribution of sample means is equal to the population mean. This value is considered unbiased, and it reflects the average of all sample means drawn from the population.
What is the standard error of the mean, and why is it important?
-The standard error of the mean (SEM) measures how much a sample mean is expected to vary from the population mean. A larger standard error indicates more variability, while a smaller one suggests more consistency in the sample means.
What is the Law of Large Numbers?
-The Law of Large Numbers states that as the sample size increases, the sample mean is more likely to be close to the population mean, making the sample more representative of the population.
How does the standard error change with increasing sample size?
-As the sample size increases, the standard error decreases. This is because larger samples are less influenced by random variation, making sample means more reliable estimates of the population mean.
What is the relationship between a z-score and the distribution of sample means?
-A z-score for a sample mean tells you how many standard deviations the sample mean is from the population mean. It is used to determine the probability of selecting a sample with a specific mean.
How does the distribution of sample means relate to the normal distribution?
-The distribution of sample means is approximately normal if the population is normal or if the sample size is large enough (n ≥ 30). This allows us to apply statistical methods that assume a normal distribution, even when the population itself is not normal.
What are the common ways to report standard error in research studies?
-Standard error is commonly reported using abbreviations like SE or SEM. It is often included in tables, along with the sample mean and other statistics, and may also be represented in graphs such as bar or line charts.
Outlines

This section is available to paid users only. Please upgrade to access this part.
Upgrade NowMindmap

This section is available to paid users only. Please upgrade to access this part.
Upgrade NowKeywords

This section is available to paid users only. Please upgrade to access this part.
Upgrade NowHighlights

This section is available to paid users only. Please upgrade to access this part.
Upgrade NowTranscripts

This section is available to paid users only. Please upgrade to access this part.
Upgrade Now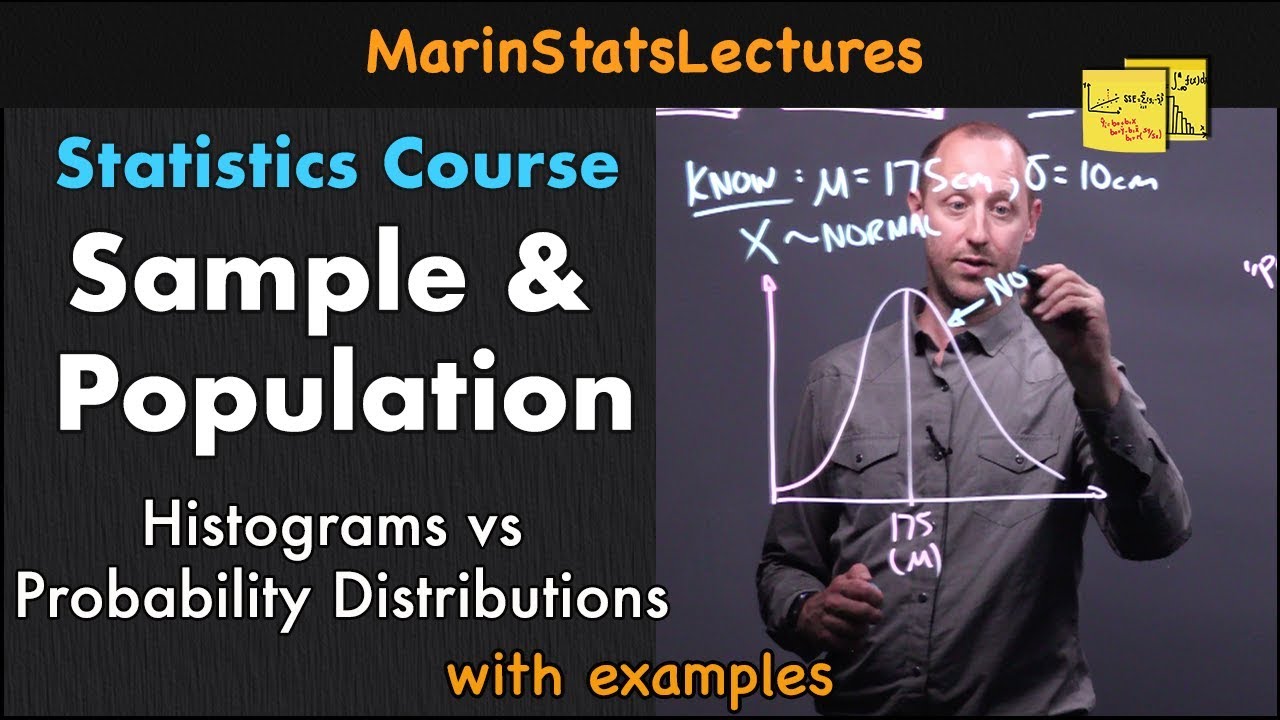


5.0 / 5 (0 votes)