The Sampling Distribution of the Difference in Sample Means (X_1 bar - X_2 bar)
Summary
TLDRThis video explains the sampling distribution of the difference in sample means, focusing on how it serves as an estimator for the difference in population means. The video covers key concepts, including the mean and variance of the sampling distribution, and uses a practical example with male and female heights to demonstrate the process of calculating probabilities. By applying the central limit theorem and normal distribution principles, the video walks through the steps to compute the likelihood of specific outcomes, making the concept accessible for statistical inference in real-world scenarios.
Takeaways
- 😀 The sampling distribution of the difference in sample means is crucial for making inferences about the difference in population means.
- 😀 The difference in sample means is an unbiased estimator for the difference in population means.
- 😀 The mean of the sampling distribution of the difference in sample means is equal to the difference in population means.
- 😀 The variance of the sampling distribution of the difference in sample means is the sum of the variances of the individual sample means.
- 😀 The sampling distribution of the difference in sample means is normal if the populations are normally distributed, or approximately normal with large sample sizes due to the Central Limit Theorem.
- 😀 The variance formula for the difference in sample means is: (σ1²/n1) + (σ2²/n2), where σ1 and σ2 are the population standard deviations, and n1 and n2 are the sample sizes.
- 😀 The Central Limit Theorem guarantees the approximate normality of the sampling distribution of the difference in sample means when the sample sizes are sufficiently large, even if the underlying populations are not normal.
- 😀 In practical examples, like comparing male and female heights, we can calculate the sampling distribution of the difference in sample means using population parameters such as the means and standard deviations.
- 😀 Probability calculations based on the sampling distribution of the difference in sample means can be performed using standard normal distribution techniques, once the distribution is standardized.
- 😀 For a practical example involving heights, the probability that the average height of males is at least 10 cm greater than the average height of females can be calculated using the standardized z-score formula, resulting in a probability of approximately 0.995.
Please replace the link and try again.
Outlines

This section is available to paid users only. Please upgrade to access this part.
Upgrade NowMindmap

This section is available to paid users only. Please upgrade to access this part.
Upgrade NowKeywords

This section is available to paid users only. Please upgrade to access this part.
Upgrade NowHighlights

This section is available to paid users only. Please upgrade to access this part.
Upgrade NowTranscripts

This section is available to paid users only. Please upgrade to access this part.
Upgrade NowBrowse More Related Video

Sampling Distributions (7.2)

GRINGS - Amostragem com Distribuição Normal aula 15

What is a Sampling Distribution? | Puppet Master of Statistics
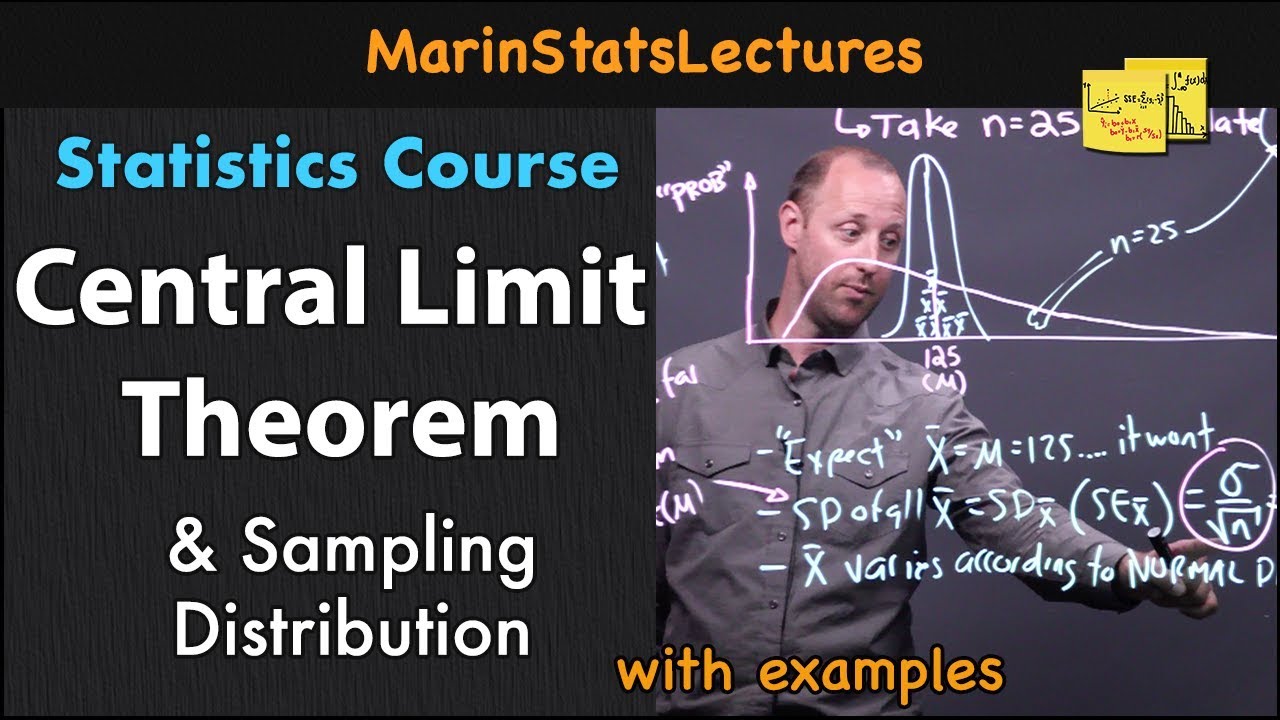
Central Limit Theorem & Sampling Distribution Concepts | Statistics Tutorial | MarinStatsLectures

Probabilitas dan Statistik: 8.6 Central Limit Theorem
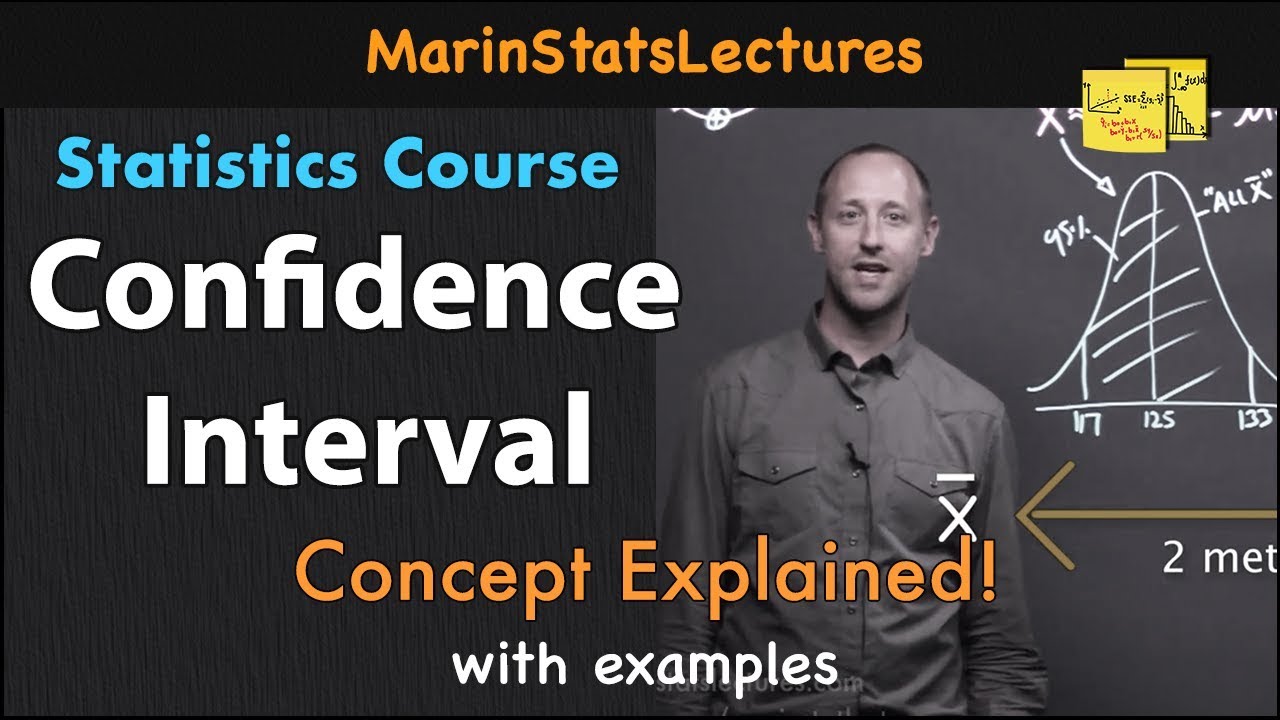
Confidence Interval Concept Explained | Statistics Tutorial #7 | MarinStatsLectures
5.0 / 5 (0 votes)