Student's T Distribution - Confidence Intervals & Margin of Error
Summary
TLDRIn this video, the focus is on using the Student's t-distribution table to solve problems related to constructing confidence intervals. The first example walks through calculating a 95% confidence interval for the population mean weight of students, explaining concepts like sample mean, standard deviation, degrees of freedom, and the t-value. The second example demonstrates how to calculate the margin of error and a 90% confidence interval for a sample of chemistry students. The video offers clear step-by-step instructions for using statistical methods to estimate population parameters, ideal for students learning these concepts.
Takeaways
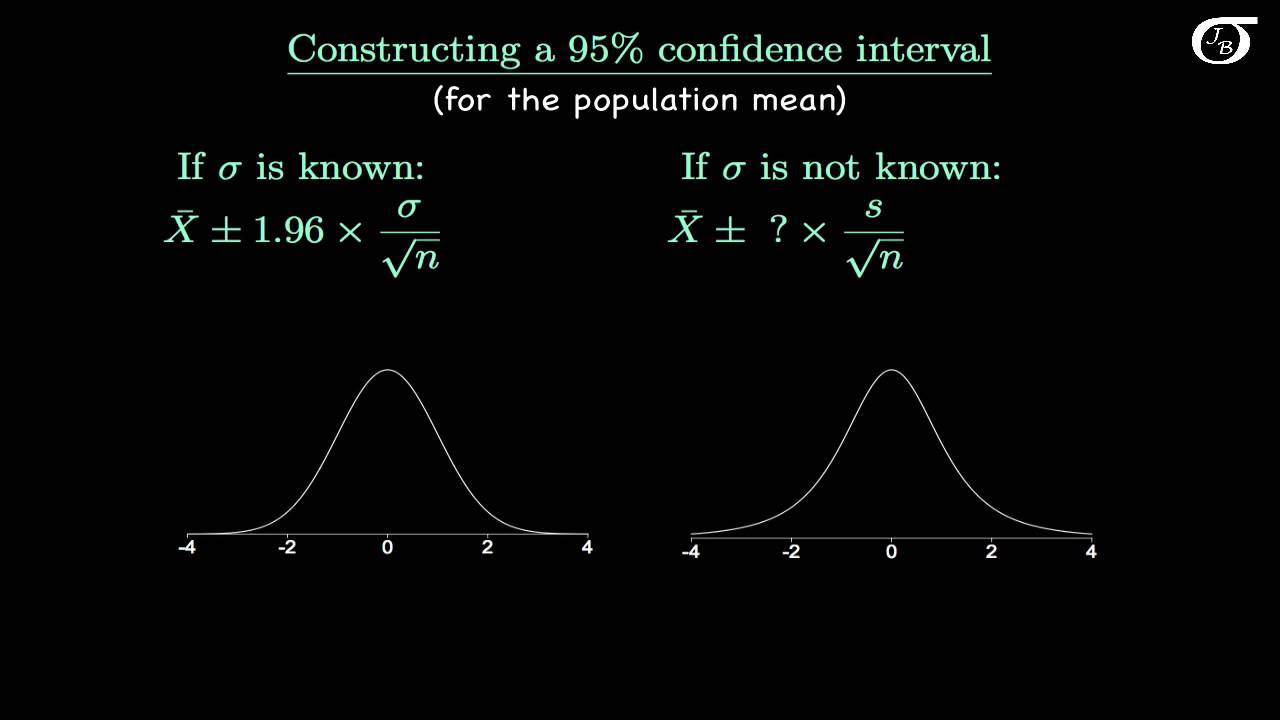
- 😀 The Student's t-distribution is used when the sample size is small (less than 30) and the population standard deviation is unknown.
- 😀 For constructing a confidence interval, we need the sample mean, sample standard deviation, and sample size.
- 😀 To calculate the t-value, use the degrees of freedom (n-1) and the alpha over 2 value (which depends on the confidence level).
- 😀 In the example with 20 students, the sample mean is 165, and the standard deviation is 4.5, making it a small sample for which we use the t-distribution.
- 😀 The formula for the confidence interval is: sample mean ± (t-value * (sample standard deviation / √n)).
- 😀 The t-value for a confidence interval is found in a Student's t-distribution table by using the degrees of freedom and the alpha over 2 value.
- 😀 The margin of error (E.B.M.) is calculated as the t-value times the sample standard deviation divided by the square root of the sample size.
- 😀 A 95% confidence interval for the average weight of students in a school would be between 162.8 and 167.1 pounds.
- 😀 For the chemistry class example with 10 students, the sample mean is 80, and the sample standard deviation is 11.709.
- 😀 For the 90% confidence interval, the margin of error was calculated as 6.787, resulting in a confidence interval between 73.213 and 86.787.
- 😀 It's important to calculate the sample standard deviation and mean accurately to ensure the correct margin of error and confidence interval.
- 😀 A t-distribution table is essential for finding the correct t-value based on degrees of freedom and alpha values when constructing confidence intervals.
Q & A
What is the first step in constructing a confidence interval using the student's t-distribution?
-The first step is to write down the given information, including the sample mean, sample size, and sample standard deviation.
Why do we use the student's t-distribution in this example instead of the normal distribution?
-We use the student's t-distribution because we are dealing with a sample standard deviation (not the population standard deviation) and the sample size is less than 30.
What does the subscript 'nu' in the t-distribution formula represent?
-'Nu' represents the degrees of freedom, which is calculated as n - 1, where n is the sample size.
How do you calculate the margin of error (E.M.) for a confidence interval?
-The margin of error is calculated by multiplying the t-value by the sample standard deviation divided by the square root of the sample size.
How do you find the t-value for constructing a confidence interval?
-To find the t-value, you refer to the student's t-distribution table based on the degrees of freedom (n-1) and the alpha over 2 value, which corresponds to the desired confidence level.
What is the significance of the 'alpha over 2' value in the context of confidence intervals?
-'Alpha over 2' represents the area in one tail of the t-distribution curve and is used to calculate the t-value. It is determined by subtracting the confidence level from 1 and dividing the result by 2.
In the first example, how do you calculate the 95% confidence interval for the population mean?
-First, find the t-value using the degrees of freedom (19) and alpha over 2 value (0.025). Then, apply the formula: sample mean ± (t-value × sample standard deviation / sqrt(n)).
What does the 95% confidence interval (162.8, 167.106) tell us about the population mean?
-This confidence interval means we are 95% confident that the true average weight of all the students in the school falls between 162.8 and 167.106 pounds.
How is the sample mean for the chemistry class calculated in the second example?
-The sample mean is calculated by adding up all the individual scores (800) and dividing by the number of students (10), resulting in a mean of 80.
What is the formula for calculating the sample standard deviation in part a of the second example?
-The sample standard deviation is calculated using the formula: s = √[(Σ(x - x̄)²) / (n - 1)], where x is each individual value, x̄ is the sample mean, and n is the sample size.
Outlines

Cette section est réservée aux utilisateurs payants. Améliorez votre compte pour accéder à cette section.
Améliorer maintenantMindmap

Cette section est réservée aux utilisateurs payants. Améliorez votre compte pour accéder à cette section.
Améliorer maintenantKeywords

Cette section est réservée aux utilisateurs payants. Améliorez votre compte pour accéder à cette section.
Améliorer maintenantHighlights

Cette section est réservée aux utilisateurs payants. Améliorez votre compte pour accéder à cette section.
Améliorer maintenantTranscripts

Cette section est réservée aux utilisateurs payants. Améliorez votre compte pour accéder à cette section.
Améliorer maintenantVoir Plus de Vidéos Connexes
Introduction to the t Distribution (non-technical)
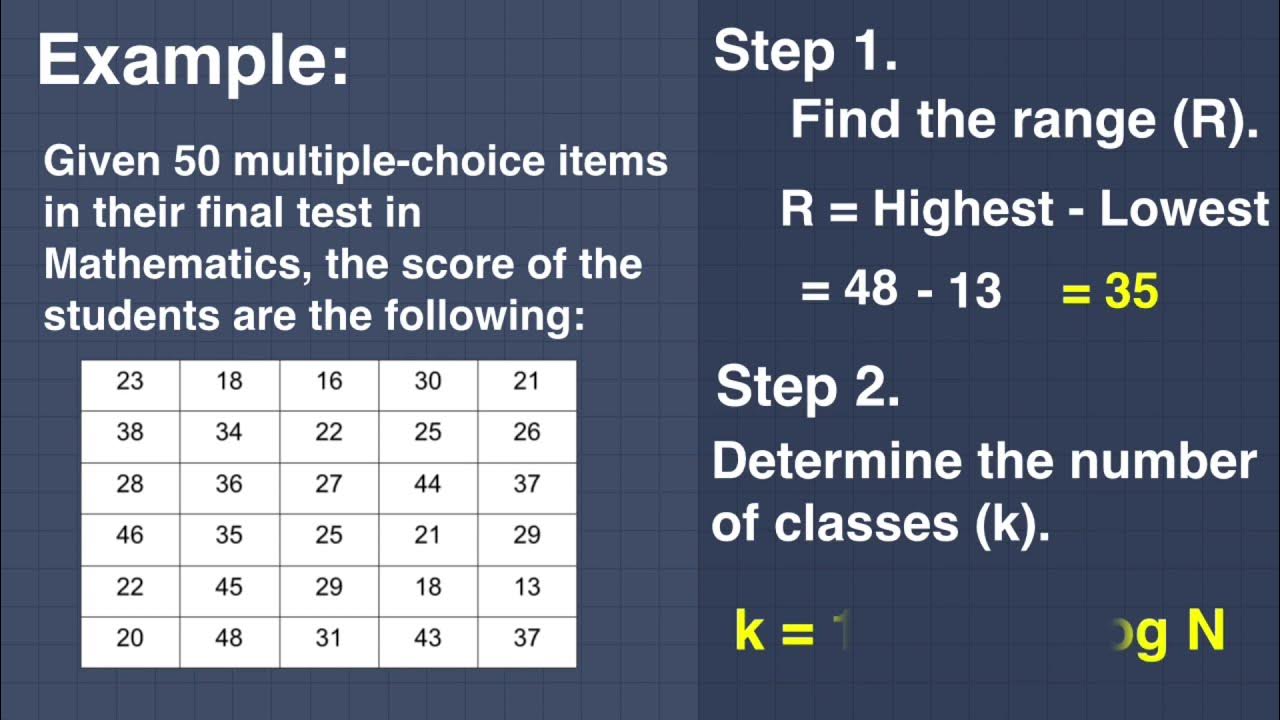
Constructing Frequency Distribution Table (Sturge's Formula)

FÁCIL e RÁPIDO | INTERVALOS REAIS | UNIÃO | INTERSEÇÃO e DIFERENÇA

The Exponential Distribution
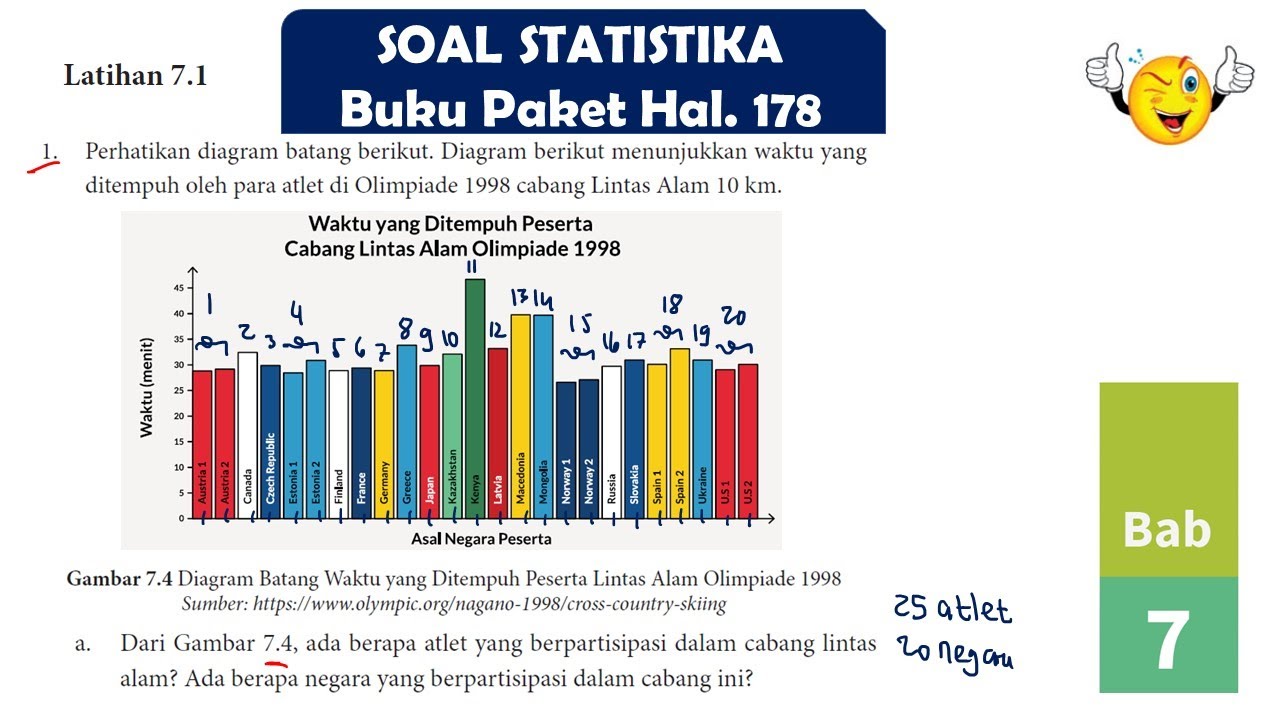
LATIHAN 7.1 NO 1, 2 DIAGRAM BATANG HISTOGRAM STATISTIKA MATEMATIKA SMA KELAS 10 #kurikulummerdeka

ÂNGULOS ALTERNOS INTERNOS E EXTERNOS FORMADOS POR RETAS PARALELAS INTERSECTADAS POR UMA TRASVERSAL
5.0 / 5 (0 votes)
