Introduction to the t Distribution (non-technical)
Summary
TLDRThe video introduces the Student t-distribution, emphasizing its relevance when the population standard deviation is unknown. It explains that the t-distribution is used instead of the standard normal distribution when constructing confidence intervals for the population mean, with the degrees of freedom playing a crucial role in determining the t-value. The video illustrates how the t-distribution approaches the standard normal distribution as degrees of freedom increase, and cautions against disregarding the t-distribution even for large sample sizes, as it remains distinct from the standard normal distribution.
Takeaways
- 📚 The t-distribution, also known as Student's t-distribution, is used when the population standard deviation is unknown and needs to be estimated by the sample standard deviation.
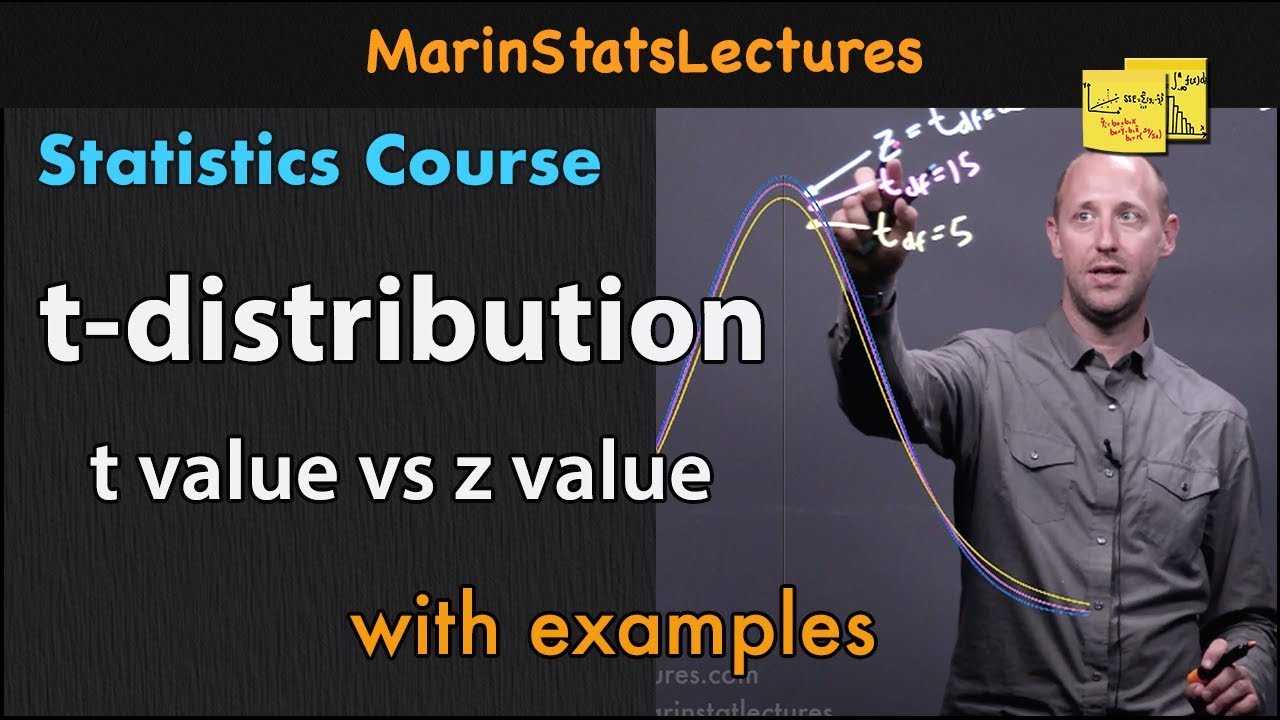
- 🔢 The t-distribution is similar to the standard normal distribution (Z-distribution) but has more variability, with heavier tails and a lower peak.
- 📈 As the degrees of freedom increase, the t-distribution approaches the standard normal distribution, becoming nearly identical at high degrees of freedom.
- 🌟 The degrees of freedom for the t-distribution is determined by the sample size (n-1), which is also the same concept used when calculating the sample variance (s^2 / (n-1)).
- 🔍 When constructing a confidence interval for the population mean (μ), if the population standard deviation (σ) is unknown, the sample standard deviation (s) must be used, and the t-distribution must be applied.
- 📊 A t-distribution with one degree of freedom is significantly different from the standard normal distribution, but as degrees of freedom increase, the differences diminish.
- 🧮 To find the appropriate t-value for a specific confidence interval and degrees of freedom, one must refer to a t-distribution table or statistical software.
- 🚫 The notion that the t-distribution can be ignored in favor of the standard normal distribution for sample sizes greater than 30 is incorrect and should not be followed.
- 📝 When using sample data to estimate a parameter, it is crucial to use values from the t-distribution rather than the standard normal distribution to avoid underestimating the margin of error.
- 📊 The shape of the t-distribution is influenced by the degrees of freedom, with higher degrees of freedom leading to a distribution shape that more closely resembles the standard normal distribution.
- 🔑 The key to statistical inference in situations where the population standard deviation is unknown lies in the correct application of the t-distribution, which accounts for the additional variability introduced by estimating σ with s.
Q & A
What is the Student t distribution?
-The Student t distribution, often shortened to simply the t distribution, is a probability distribution that is used when the population standard deviation is unknown and is estimated by the sample standard deviation.
Why do we use the t distribution instead of the standard normal distribution in certain cases?
-We use the t distribution instead of the standard normal distribution when the population standard deviation (sigma) is unknown and we have to estimate it using the sample standard deviation (s). This introduces more variability, and thus the t distribution has greater variance and heavier tails compared to the standard normal distribution.
How does the t distribution differ from the standard normal distribution?
-The t distribution is similar to the standard normal distribution in that both are symmetric about zero and bell-shaped. However, the t distribution has heavier tails and a lower peak, which accounts for the additional variability when using the sample standard deviation as an estimate for the population standard deviation.
What are degrees of freedom in the context of the t distribution?
-In the context of the t distribution, degrees of freedom refer to a parameter that influences the shape of the distribution. Specifically, in the formula for the t distribution, the degrees of freedom are equal to the sample size minus one (n-1).
How does the shape of the t distribution change with increasing degrees of freedom?
-As the degrees of freedom increase, the t distribution tends to resemble the standard normal distribution more closely. With higher degrees of freedom, the t distribution's tails become lighter and its peak becomes higher, approaching the shape of the standard normal distribution.
What is the implication of the t distribution's shape for statistical inference?
-The shape of the t distribution has implications for constructing confidence intervals. When the population standard deviation is unknown, and the sample standard deviation is used as an estimate, the critical values for constructing confidence intervals are taken from the t distribution rather than the standard normal distribution.
How do you determine the appropriate t value for a 95% confidence interval?
-To determine the appropriate t value for a 95% confidence interval, you place 95% of the area in the middle of the distribution and split the remaining 5% evenly into the two tails. The t value that corresponds to an area to the right of 0.025 (the right tail) is used as the critical value for the confidence interval.
What happens to the t value as the degrees of freedom approach infinity?
-As the degrees of freedom approach infinity, the t value for a 95% confidence interval converges to the z value of 1.96 from the standard normal distribution. This is because a t distribution with infinite degrees of freedom is effectively the same as the standard normal distribution.
Why should we not use the standard normal distribution values when the sample standard deviation is used as an estimate for the population standard deviation?
-Using the standard normal distribution values when the sample standard deviation is used as an estimate for the population standard deviation can lead to an underestimation of the margin of error. The t distribution accounts for the additional variability introduced by estimating the population standard deviation from sample data, so it is more appropriate to use t distribution values in such cases.
What is the recommended approach for using the t distribution, regardless of the sample size?
-The recommended approach is to use the t distribution for statistical inference when the population standard deviation is unknown and the sample standard deviation is used as an estimate, regardless of the sample size. This ensures that the confidence intervals and other statistical inferences are adjusted for the additional variability present in the estimation of the population parameter.
How can one find the appropriate t value for a given confidence interval and degrees of freedom?
-The appropriate t value for a given confidence interval and degrees of freedom can be found using a t table or statistical software. These resources provide t values for various confidence levels and degrees of freedom, allowing for accurate construction of confidence intervals and other statistical analyses.
Outlines

This section is available to paid users only. Please upgrade to access this part.
Upgrade NowMindmap

This section is available to paid users only. Please upgrade to access this part.
Upgrade NowKeywords

This section is available to paid users only. Please upgrade to access this part.
Upgrade NowHighlights

This section is available to paid users only. Please upgrade to access this part.
Upgrade NowTranscripts

This section is available to paid users only. Please upgrade to access this part.
Upgrade NowBrowse More Related Video
t-distribution in Statistics and Probability | Statistics Tutorial #9 | MarinStatsLectures
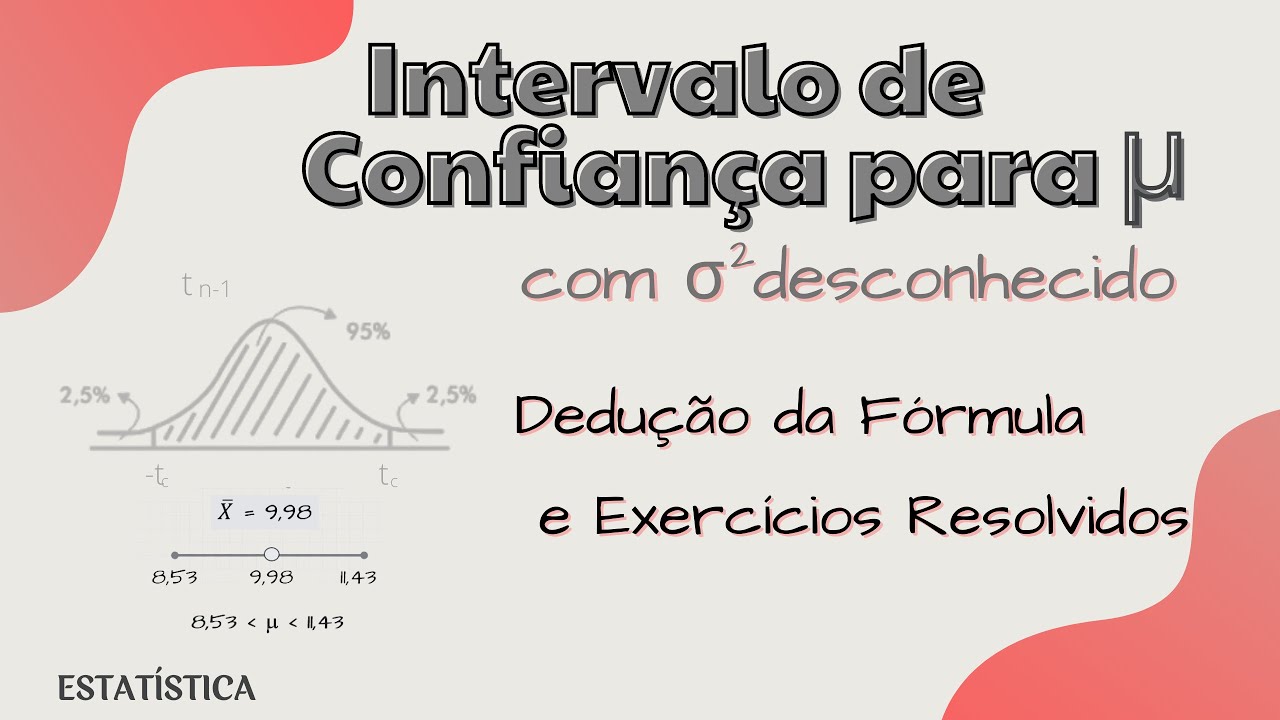
Intervalo de Confiança para a MÉDIA (μ) com variância populacional desconhecida
Confidence Interval Concept Explained | Statistics Tutorial #7 | MarinStatsLectures

Pemilihan statistik Z atau t
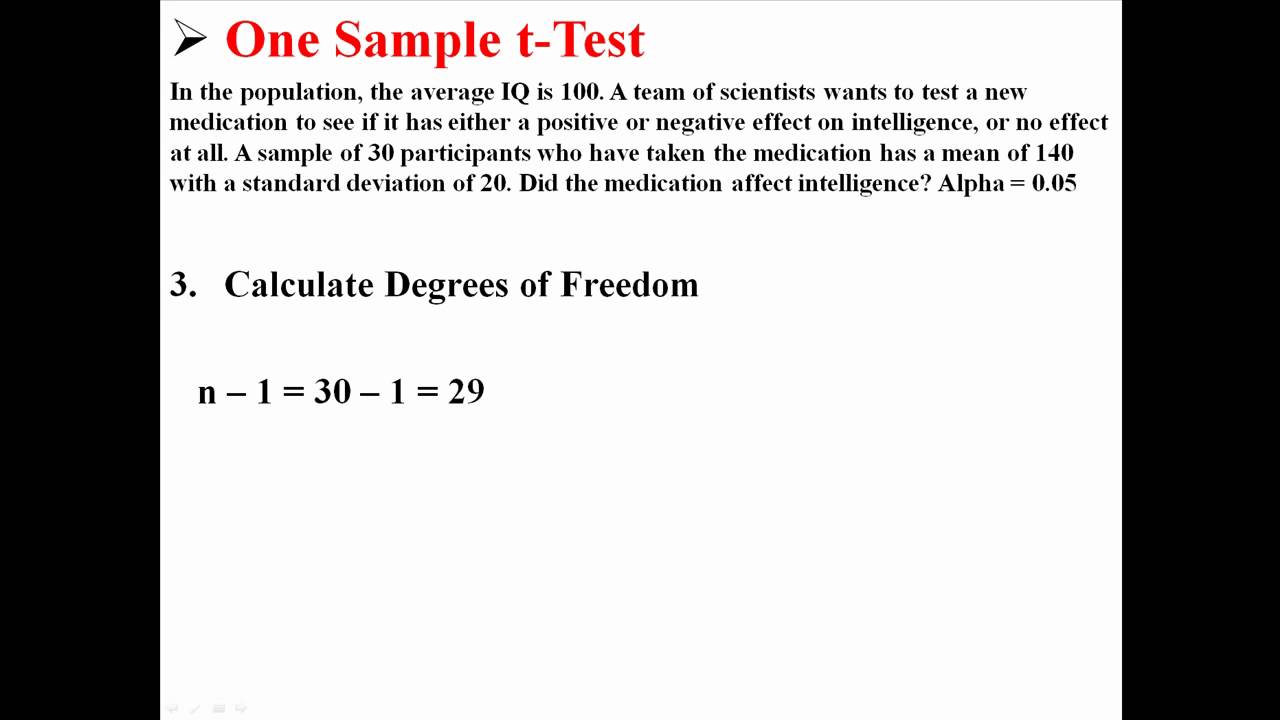
One Sample t-Test

t-tests mini lecture
5.0 / 5 (0 votes)