Constructing Frequency Distribution Table (Sturge's Formula)
Summary
TLDRIn this video, the process of constructing a frequency distribution table (FDT) is explained in detail. It begins with defining the concept of a frequency distribution table and explaining when it is needed, such as with large data sets. The steps for constructing the table are covered, including calculating the range, determining the number of classes, and class intervals. The video further demonstrates how to use the table for central tendency measures and positions. Practical examples are provided, including tallying data, calculating class marks, and filling in additional columns like cumulative frequency, all aimed at simplifying the construction process.
Takeaways
- 😀 A frequency distribution table is a grouping of numerical observations into intervals, along with a count of observations that fall within each interval.
- 😀 Frequency distribution tables are useful for summarizing categorical values, especially when variables have many distinct values.
- 😀 Frequency distribution tables should be constructed when there are at least 30 data observations.
- 😀 To construct a frequency distribution table, start by finding the range (highest score - lowest score).
- 😀 Use the storage formula to determine the number of classes (k), which involves using the logarithm of the number of observations.
- 😀 The class interval is determined by dividing the range by the number of classes and rounding up if needed.
- 😀 The table can be constructed by adding the class interval to the lowest value and continuing for each row.
- 😀 Tally marks are used to count how many observations fall into each interval or class.
- 😀 Once frequencies are tallied, the total number of respondents or participants should match the total observations (n).
- 😀 The frequency distribution table can be expanded to calculate the mean, median, mode, and measures of position like quartiles and percentiles.
- 😀 Additional columns like class mark, frequency times class mark (fx), lower class boundary, and less than cumulative frequency help in analyzing data further.
Q & A
What is a frequency distribution table?
-A frequency distribution table is a grouping of numerical observations into intervals or classes, along with a count of the number of observations that fall in each interval or class. It is mainly used to summarize categorical values and is helpful when dealing with large data sets.
When should you construct a frequency distribution table?
-A frequency distribution table should be constructed when there are at least 30 data observations or row scores. This ensures the data can be effectively summarized into classes for analysis.
How do you calculate the range for a frequency distribution table?
-The range (R) is calculated by subtracting the lowest score from the highest score. For example, if the highest score is 48 and the lowest is 13, the range would be 35.
What formula is used to determine the number of classes (k) for a frequency distribution table?
-The formula to determine the number of classes is k = 1 + 3.322 * log(n), where n is the number of data points. For example, if n = 30, the number of classes would be approximately 6.
How do you calculate the class interval for a frequency distribution table?
-The class interval (i) is calculated by dividing the range (R) by the number of classes (k). For example, if the range is 35 and the number of classes is 6, the class interval would be approximately 6.
What is the purpose of determining the class intervals in a frequency distribution table?
-The class intervals define the ranges for grouping the data into classes. Each interval represents a specific range of values, helping to organize and analyze the data more easily.
How do you ensure the highest value is included in the upper class of a frequency distribution table?
-To include the highest value in the upper class, you need to adjust the class boundaries. For example, if the highest score is 48, it would be included in the class interval 43-48.
How do you calculate the class mark (midpoint) for each class interval?
-The class mark, or midpoint, is calculated by adding the lower and upper bounds of each class interval and dividing by 2. For example, for the class interval 13-18, the class mark is (13 + 18) / 2 = 15.5.
What is the formula for calculating the frequency times class mark (fx) in a frequency distribution table?
-To calculate the frequency times class mark (fx), you multiply the frequency of each class by its corresponding class mark. For example, if the frequency is 5 and the class mark is 15.5, fx would be 5 * 15.5 = 77.5.
What is the purpose of calculating the 'less than cumulative frequency' in a frequency distribution table?
-The 'less than cumulative frequency' column helps track the cumulative total of frequencies up to each class interval. It is useful for calculating measures of position, such as the median or percentiles.
Outlines

This section is available to paid users only. Please upgrade to access this part.
Upgrade NowMindmap

This section is available to paid users only. Please upgrade to access this part.
Upgrade NowKeywords

This section is available to paid users only. Please upgrade to access this part.
Upgrade NowHighlights

This section is available to paid users only. Please upgrade to access this part.
Upgrade NowTranscripts

This section is available to paid users only. Please upgrade to access this part.
Upgrade NowBrowse More Related Video
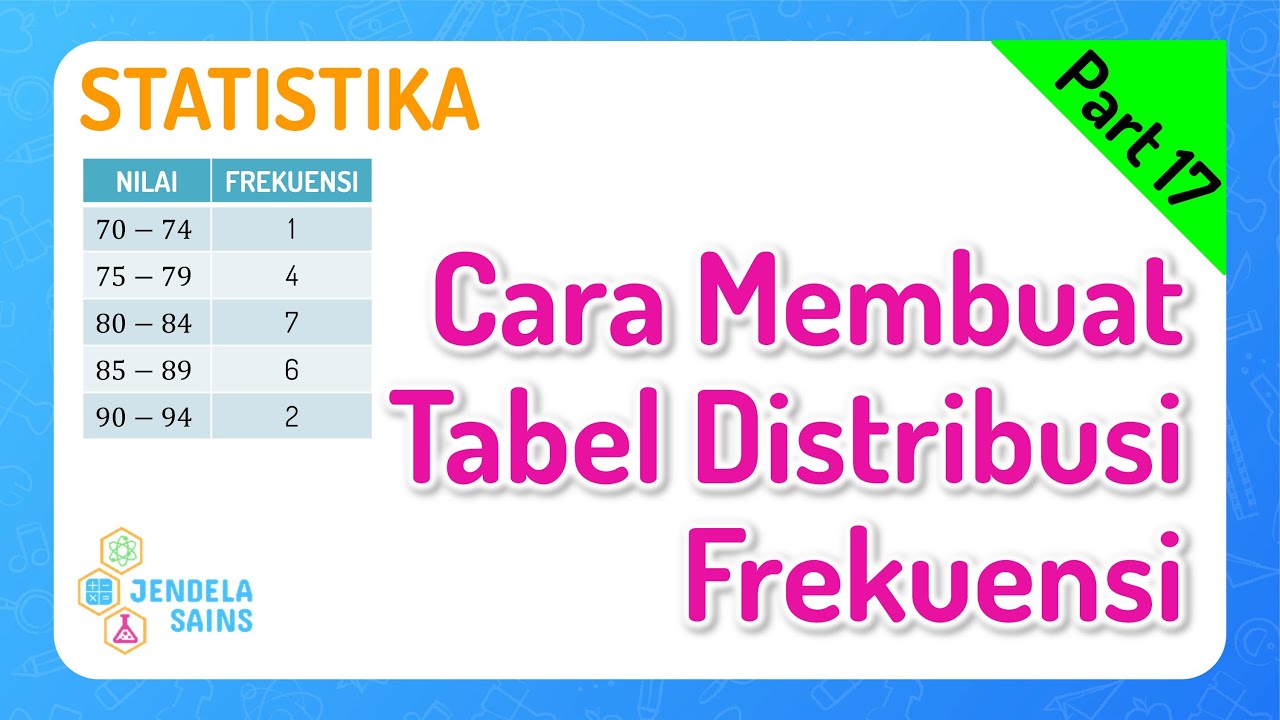
Statistika • Part 17: Cara Membuat Tabel Distribusi Frekuensi
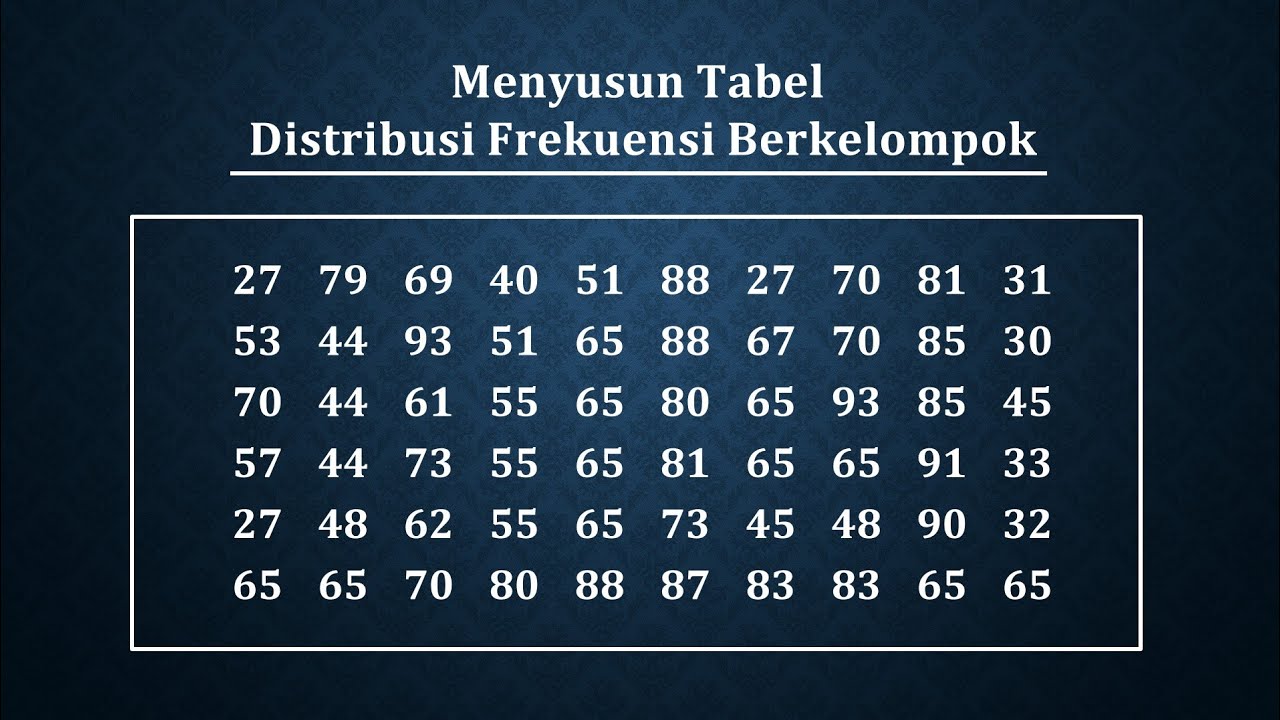
Cara menyusun tabel distribusi frekuensi berkelompok
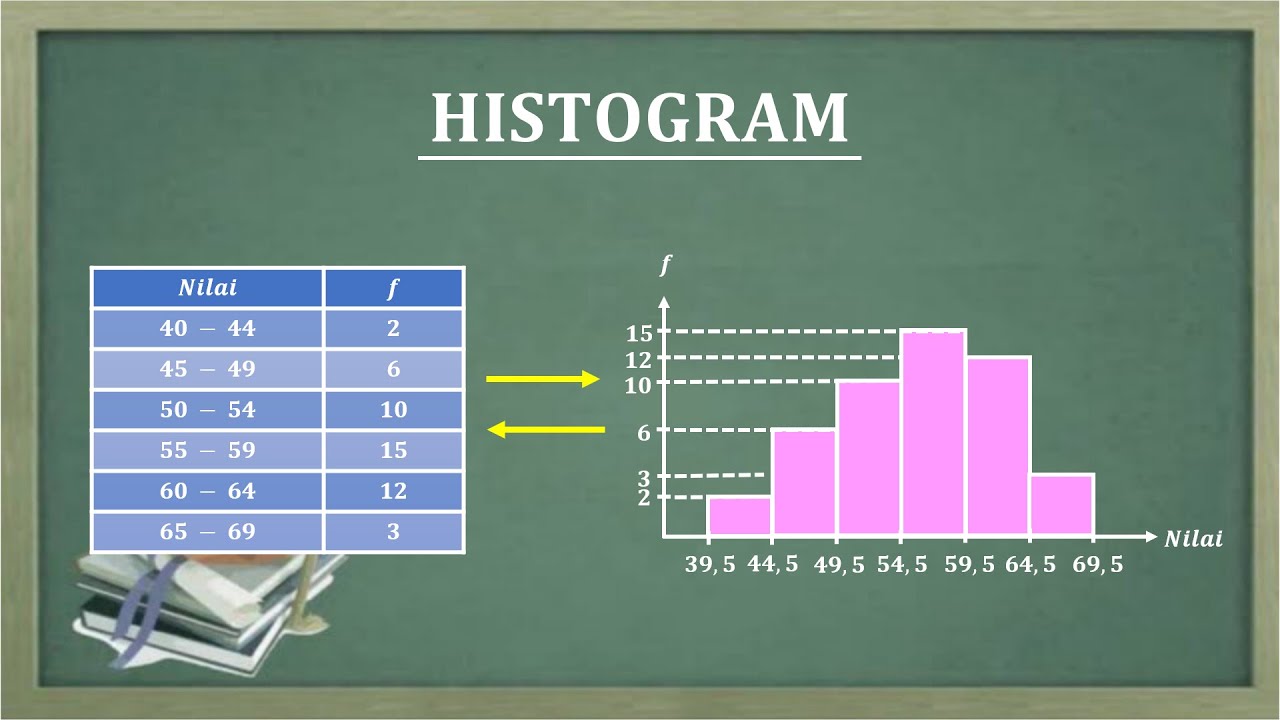
HISTOGRAM
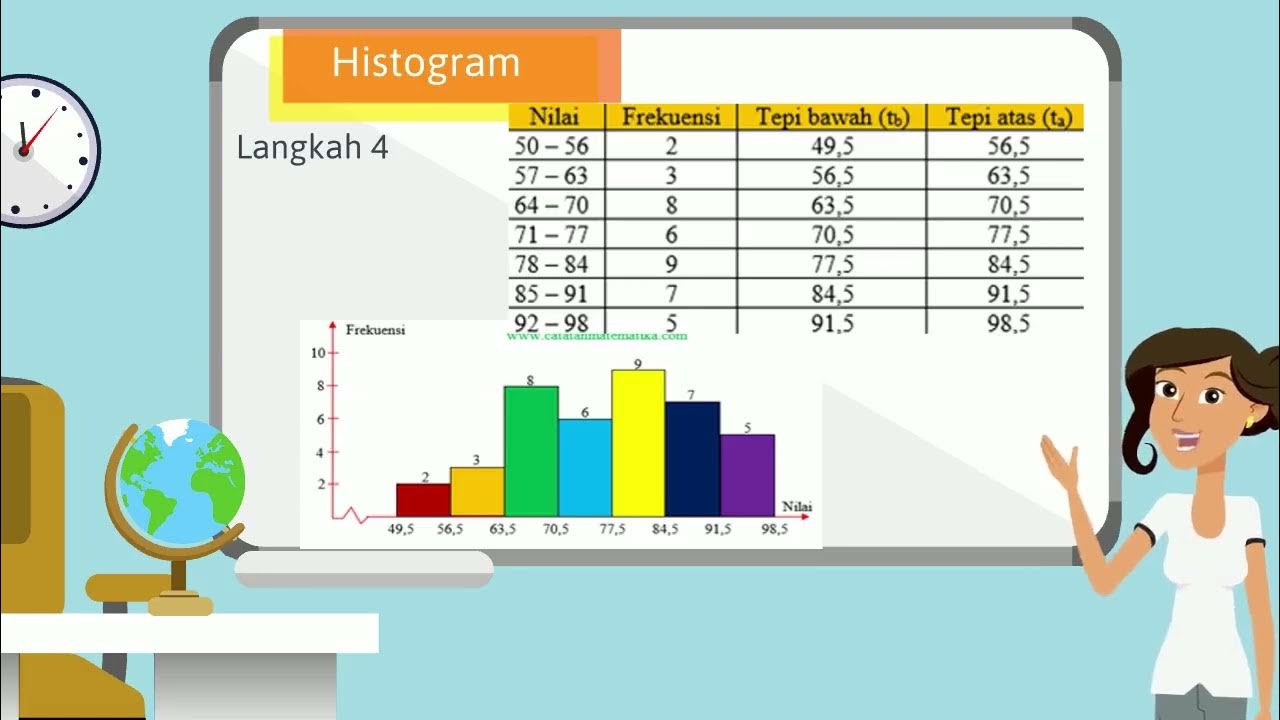
VIDEO ANIMASI MATEMATIKA MATERI PENYAJIAN DATA KELAS 10

VIDEO PEMBELAJARAN DARING STATISTIKA MODEL PROBLEM BASED LEARNING PPG DALJAB UNNES 2020
LATIHAN 7.1 NO 1, 2 DIAGRAM BATANG HISTOGRAM STATISTIKA MATEMATIKA SMA KELAS 10 #kurikulummerdeka
5.0 / 5 (0 votes)