Statistik Inferensial
Summary
TLDRThis video introduces the concept of inferential statistics, explaining its distinction from descriptive statistics. It covers essential topics such as population vs. sample, parameters vs. statistics, and hypothesis testing. The video emphasizes how inferential statistics allows conclusions to be drawn about populations from sample data, discussing techniques like p-values, confidence intervals, and effect size. It also explains the importance of understanding statistical significance and practical significance, highlighting common mistakes in interpreting data. The content is designed for those seeking a foundational understanding of inferential statistics and its applications in research.
Takeaways
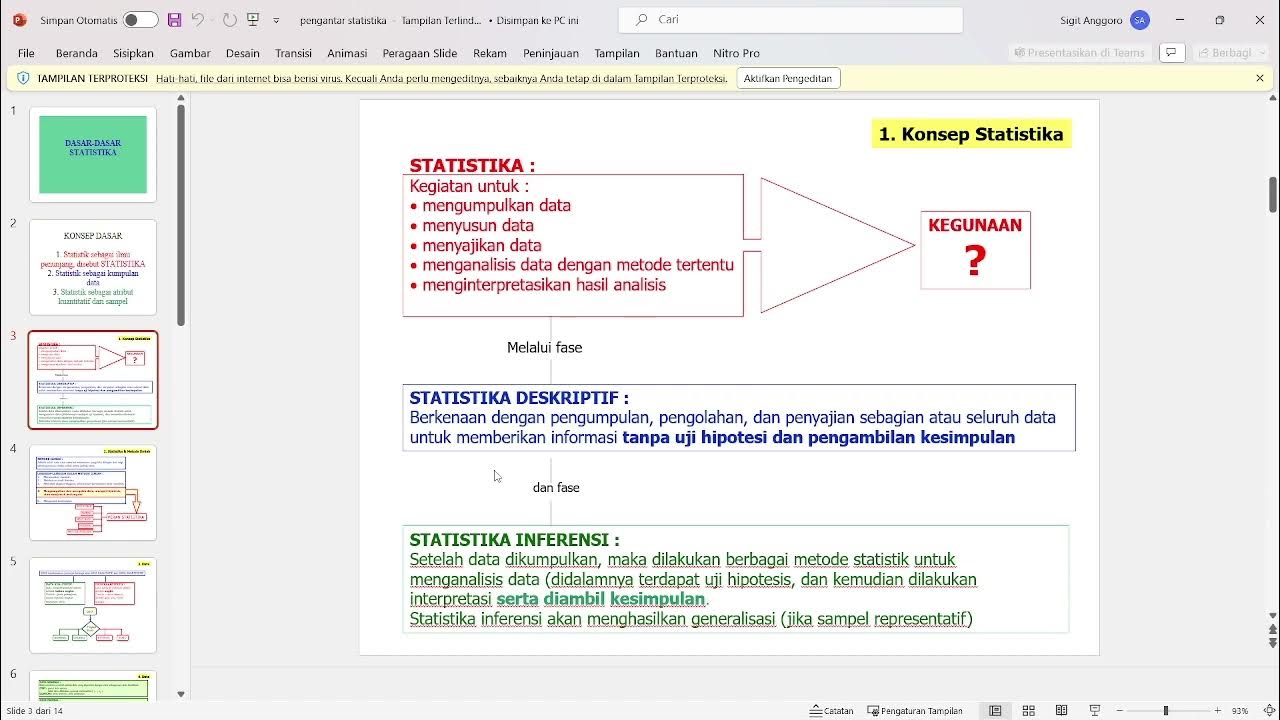
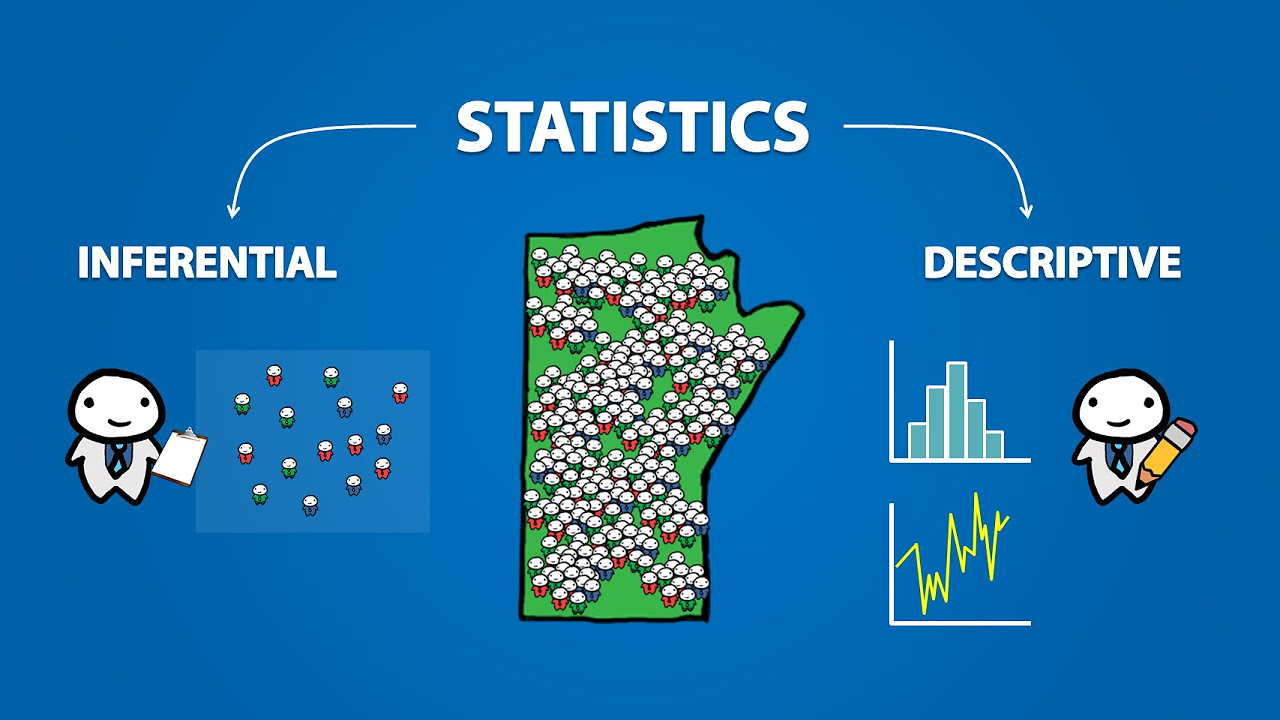
- 😀 Inferential statistics allows us to make conclusions about a population based on a sample, unlike descriptive statistics which only summarizes data.
- 😀 A population includes all members of a group, while a sample is a subset used to represent the population.
- 😀 Parameters describe populations (e.g., μ), while statistics describe samples (e.g., m) and are used to estimate parameters.
- 😀 The main tasks of inferential statistics are estimating population parameters and testing hypotheses.
- 😀 Hypothesis testing involves null (H₀) and alternative (H₁) hypotheses, with significance levels (α) commonly set at 0.05.
- 😀 P-values indicate the probability of observing results given that the null hypothesis is true; smaller p-values provide stronger evidence against H₀.
- 😀 Confidence intervals provide a range of plausible values for a population parameter, reflecting the precision of the estimate.
- 😀 Effect size measures the magnitude of differences or relationships, complementing statistical significance for practical interpretation.
- 😀 Parametric tests assume normality, homogeneity, independence, and interval/ratio data; nonparametric tests do not require these assumptions.
- 😀 Choosing the correct statistical test depends on data type, number of groups, and whether the groups are independent or related.
- 😀 Common mistakes include assuming statistical significance implies practical importance, misinterpreting p-values, and ignoring effect size and confidence intervals.
- 😀 Examples of tests: independent t-test (2 independent interval groups), paired t-test (2 related interval groups), ANOVA (3+ independent interval groups), Pearson correlation (2 interval variables), Chi-square (categorical data).
Q & A
What is inferential statistics and why is it used?
-Inferential statistics is a statistical technique that allows conclusions or generalizations about a population based on data from a sample. It is used because collecting data from the entire population is often impractical due to cost, time, or size constraints.
What is the difference between descriptive and inferential statistics?
-Descriptive statistics summarizes and describes data using measures such as mean, median, and standard deviation. Inferential statistics goes further by using sample data to draw conclusions or make generalizations about a population, often involving hypothesis testing, P values, and confidence intervals.
What is the difference between a population and a sample?
-A population includes all members of the group under study, while a sample is a subset of the population that is actually analyzed. Samples are assumed to be representative of the population.
What are parameters and statistics, and how do they differ?
-A parameter is a value that describes a population (e.g., μ for population mean), usually unknown. A statistic describes a sample (e.g., x̄ for sample mean) and is used to estimate the population parameter.
What is a P value and how is it interpreted?
-A P value is the probability of obtaining results as extreme as observed, assuming the null hypothesis is true. A smaller P value indicates stronger evidence against the null hypothesis. If P < α (e.g., 0.05), the null hypothesis is rejected in favor of the alternative hypothesis.
What is a confidence interval and why is it important?
-A confidence interval provides a range of values likely to contain the true population parameter. For example, a 95% confidence interval means we are 95% confident the true mean lies within the interval. It shows the precision and uncertainty of an estimate.
What is effect size and why should it be reported along with the P value?
-Effect size measures the magnitude of an effect or difference, indicating practical significance. P values only show whether an effect exists, not its size. Reporting both effect size and confidence intervals provides a more complete understanding of the results.
What are the assumptions of parametric statistics?
-Parametric statistics assume: 1) Normality – data are approximately normally distributed, 2) Homogeneity of variance – variances across groups are equal, 3) Independence – measurements are independent, 4) Data are interval or ratio scale.
When should non-parametric statistics be used?
-Non-parametric statistics should be used when data do not meet the assumptions of parametric tests, such as non-normal distribution, ordinal or nominal data, or small sample sizes.
How do you choose the correct statistical test based on data type and research question?
-The choice depends on: 1) Number of groups (two or more), 2) Data type (interval, ratio, ordinal, nominal), 3) Relationship of groups (independent or related), and 4) Distribution assumptions. Examples: Independent t-test for two interval independent groups, paired t-test for two related interval groups, ANOVA for more than two groups, Pearson correlation for interval variables, Chi-square for categorical variables.
What are common mistakes researchers make in inferential statistics?
-Common mistakes include: 1) Assuming statistical significance implies practical importance, 2) Misinterpreting P values, 3) Ignoring effect size and confidence intervals. These mistakes can lead to incorrect conclusions about the real-world relevance of results.
What is the difference between point estimates and interval estimates?
-A point estimate is a single value used to estimate a population parameter, such as the sample mean. An interval estimate provides a range of plausible values, like a confidence interval, accounting for sampling variability and uncertainty.
Outlines

Cette section est réservée aux utilisateurs payants. Améliorez votre compte pour accéder à cette section.
Améliorer maintenantMindmap

Cette section est réservée aux utilisateurs payants. Améliorez votre compte pour accéder à cette section.
Améliorer maintenantKeywords

Cette section est réservée aux utilisateurs payants. Améliorez votre compte pour accéder à cette section.
Améliorer maintenantHighlights

Cette section est réservée aux utilisateurs payants. Améliorez votre compte pour accéder à cette section.
Améliorer maintenantTranscripts

Cette section est réservée aux utilisateurs payants. Améliorez votre compte pour accéder à cette section.
Améliorer maintenantVoir Plus de Vidéos Connexes


5.0 / 5 (0 votes)
