Introduction to Statistics (1.1)

Simple Learning Pro
16 Oct 201504:50

Summary

TLDRThis script introduces the fundamental concepts of statistics, distinguishing between inferential and descriptive statistics. It explains how statistics measure variability in traits like height and preferences, using samples to make inferences about populations. Descriptive statistics summarize data with tools like histograms, while inferential statistics make broader claims. The script also covers key definitions, such as population, sample size, and variables, and differentiates between categorical and quantitative data, including discrete, continuous, ordinal, and nominal types.

Takeaways

  • πŸ“Š Statistics is the collection and interpretation of data to measure and analyze variability in characteristics such as height, weight, and preferences.
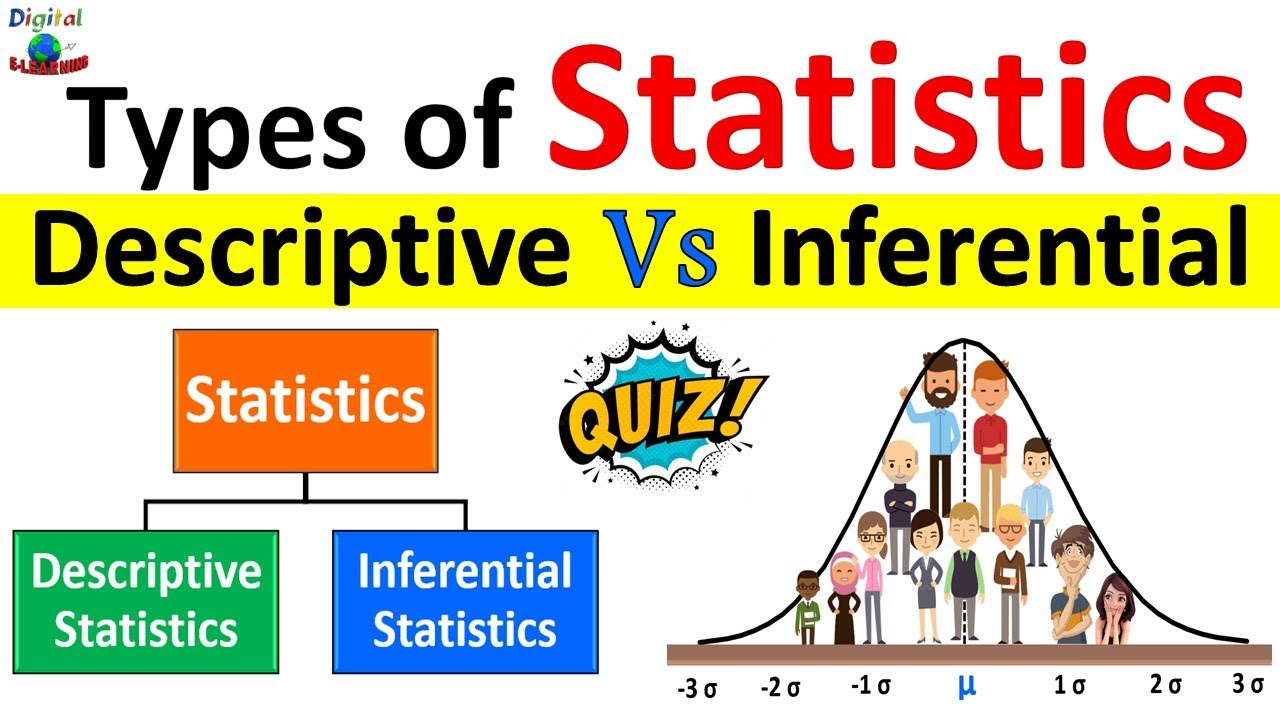
  • πŸ” There are two types of statistics: inferential, which makes judgments about a population based on a sample, and descriptive, which summarizes and explains data.
  • πŸ“š Descriptive statistics is used to provide summaries, like average scores, using tools like histograms and graphs.
  • 🧐 Inferential statistics involves using a sample to make broader claims about a population.
  • 🌐 A population in statistics refers to the entire set of items or subjects under study, which can be anything from people to vehicles.
  • πŸ” A sample is a subset of the population used for study, with the number of items in the sample known as the sample size.
  • πŸ“ Variables are the characteristics being studied and can be measured, counted, or categorized, such as height or hair color.
  • πŸ“Š Data can be either categorical, which groups items into categories like hair color, or quantitative, which involves numerical measurements like height.
  • πŸ”’ Quantitative data comes from variables that can be measured numerically and are suitable for arithmetic calculations, such as calculating an average.
  • πŸ—‚ Categorical data comes from variables that categorize items, with two types being ordinal, which has a logical order like letter grades, and nominal, which does not, like hair color.
  • πŸ”’ Quantitative variables can be discrete, which can only take certain numbers like the number of pets, or continuous, which can take any numerical value like weight.

Q & A

  • What is the definition of statistics according to the transcript?

    -Statistics can be defined as the collection and interpretation of data, which is used to measure and analyze variability in various aspects such as height, weight, hair color, and food preferences among individuals.

  • What are the two kinds of statistics mentioned in the transcript?

    -The two kinds of statistics are inferential statistics and descriptive statistics.

  • What does inferential statistics involve?

    -Inferential statistics involves taking a sample, analyzing it, and making judgments or claims about a population based on that sample.

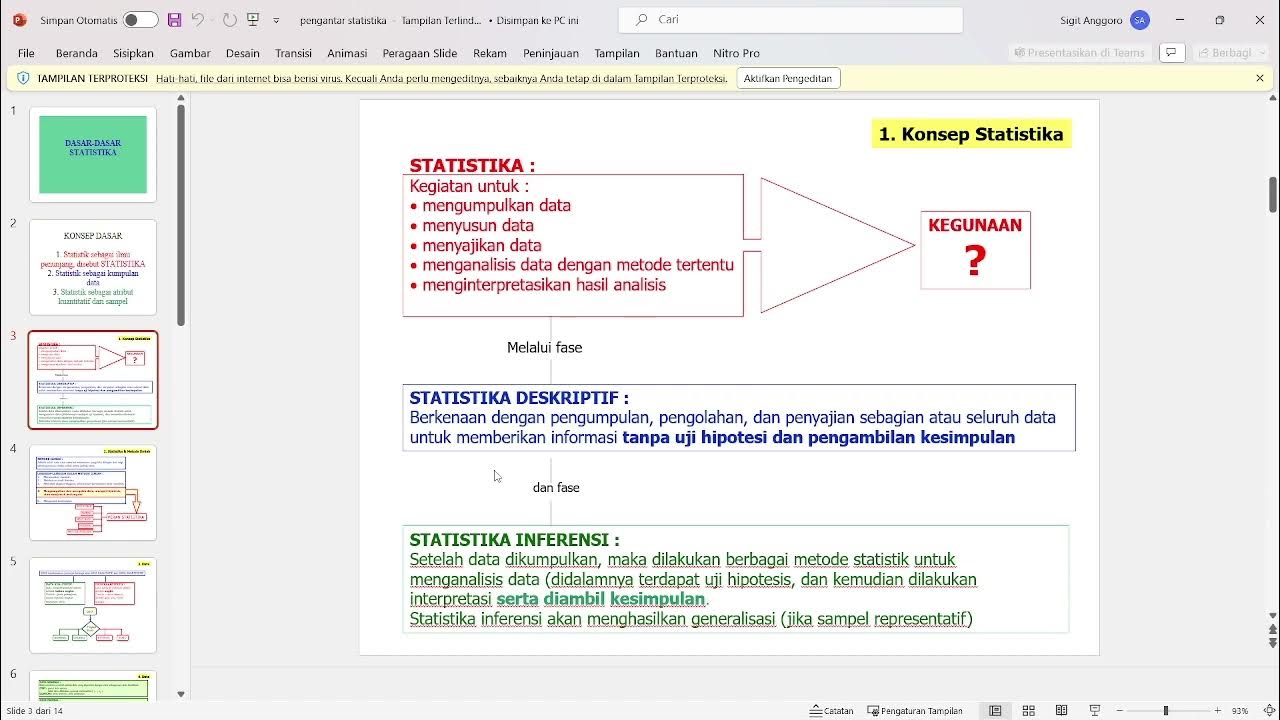
  • How is descriptive statistics different from inferential statistics?

    -Descriptive statistics refers to the process of collecting data and summarizing it through means such as histograms and graphs, without making inferences about the larger population.

  • What is a population in the context of statistics?

    -A population in statistics refers to the total amount of things being studied, which can be people, cats, vehicles, houses, or almost anything.

  • What is a sample and what is its significance in statistics?

    -A sample is a small part of the population that is used for study. It is significant because it allows researchers to examine and extract information from a subset of the population.

  • What is meant by sample size in statistics?

    -Sample size in statistics refers to the total number of things or individuals included in a sample.

  • What is a variable in the context of statistics?

    -A variable in statistics is a characteristic of what is being studied, which can be measurable, countable, and categorized, and varies among different individuals.

  • What is the difference between categorical data and quantitative data?

    -Categorical data refers to values that place things into different groups or categories, such as hair color or type of cat. Quantitative data, on the other hand, is measured in numbers and is suitable for arithmetic calculations, such as height or weight.

  • What are the two types of categorical variables mentioned in the transcript?

    -The two types of categorical variables are categorical and ordinal, and categorical and nominal. Categorical and ordinal variables have a logical ordering, like letter grades. Categorical and nominal variables do not have a logical ordering, such as hair color.

  • What are the two types of quantitative variables and how do they differ?

    -The two types of quantitative variables are discrete and continuous. Discrete variables can only be measured in certain numbers, like the number of pets one owns. Continuous variables can take on any numerical value and can be measured in many decimal places, like weight.

Outlines

00:00

πŸ“Š Introduction to Statistics and Data Types

This paragraph introduces the fundamental concept of statistics as the process of collecting and interpreting data, highlighting the importance of understanding variability in different aspects of life. It distinguishes between inferential and descriptive statistics, with the former using samples to make judgments about a population and the latter focusing on summarizing and explaining data through means like histograms and graphs. The paragraph also introduces basic statistical definitions such as population, sample, sample size, and variable, and explains the difference between categorical and quantitative data, including the subtypes of categorical (ordinal and nominal) and quantitative (discrete and continuous) variables.

Mindmap

Keywords

πŸ’‘Statistics

Statistics is the discipline that concerns the collection, analysis, interpretation, presentation, and organization of data. It plays a central role in the video's theme as it is the main subject being discussed. The script explains that statistics can be divided into two kinds: inferential and descriptive, and it uses the concept to analyze various aspects of human variability such as height, weight, and preferences.

πŸ’‘Inferential Statistics

Inferential statistics is a branch of statistics that deals with drawing conclusions from data. It is used to make predictions or generalizations about a population from a sample. The video script uses this term to describe the process of making judgments or claims about a larger group based on the analysis of a smaller subset of data.

πŸ’‘Descriptive Statistics

Descriptive statistics refers to the methods used to summarize and describe the characteristics of a dataset. It is mentioned in the script as the initial part of the course, which involves using histograms and graphs to explain data. An example given in the script is stating the average midterm score, which is a use of descriptive statistics.

πŸ’‘Population

In the context of the video, a population is defined as the entire group or set of individuals, items, or events being studied. It is a fundamental concept in statistics and is used to describe the totality of the subject matter, such as all people, all cats, or all vehicles, as examples provided in the script.

πŸ’‘Sample

A sample is a subset of the population that is taken for the purpose of study. The script explains that a sample is used to represent and analyze the larger population. The size of the sample, or the number of elements in the sample, is referred to as the sample size.

πŸ’‘Sample Size

Sample size refers to the number of observations or elements in a sample. It is an important aspect of statistical analysis as it can affect the reliability and validity of the conclusions drawn from the sample, as mentioned in the script.

πŸ’‘Variable

A variable in statistics is a characteristic that can vary from one observation to another. The script uses the term to describe attributes such as height, weight, and hair color, which are measured or observed in a study and can differ among individuals.

πŸ’‘Quantitative Data

Quantitative data refers to numerical data that can be measured and used for arithmetic calculations. The script explains that quantitative data comes from quantitative variables like height, weight, and midterm scores, which can be added, averaged, or otherwise mathematically manipulated.

πŸ’‘Categorical Data

Categorical data is data that places items into different groups or categories. The script distinguishes between categorical data and quantitative data, providing examples like hair color and letter grades, which cannot be averaged but can be counted or categorized.

πŸ’‘Categorical Variables

Categorical variables are variables that have a limited number of possible values, each representing a group or a category. The script mentions two types of categorical variables: ordinal, which has a logical order, and nominal, which does not.

πŸ’‘Ordinal Data

Ordinal data is a type of categorical data where the categories have a logical order or ranking. The script uses the example of letter grades, which can be ordered from high to low, to illustrate this concept.

πŸ’‘Nominal Data

Nominal data is categorical data where the categories do not have a logical order. The script provides the example of hair color, which can be categorized but does not have an inherent order, such as red, blond, or blue.

πŸ’‘Quantitative Variables

Quantitative variables are variables that produce quantitative data, which can be measured and expressed as numbers. The script distinguishes between two types of quantitative variables: discrete and continuous.

πŸ’‘Discrete Variables

Discrete variables are variables that can only take certain distinct values, typically whole numbers. The script uses the example of the number of pets one can own, which can only be a whole number and not a fraction, to explain discrete variables.

πŸ’‘Continuous Variables

Continuous variables are variables that can take on any value within a range. The script explains that continuous variables, such as weight, can be measured with any degree of precision, including decimal places, making them different from discrete variables.

Highlights

Statistics is defined as the collection and interpretation of data.

Statistics measures and analyzes variability in attributes such as height, weight, and food preferences.

There are two kinds of statistics: inferential and descriptive.

Inferential statistics involves making judgments about a population based on a sample.

Descriptive statistics involves summarizing and explaining data through graphs and histograms.

A population refers to the total amount of things being studied, such as people, cats, or vehicles.

A sample is a small part of the population used for study, with a specific sample size.

Variables represent characteristics of what is being studied and can vary among individuals.

Data can be either categorical, placing things into groups, or quantitative, measured in numbers.

Categorical data comes from categorical variables, such as hair color or type of cat.

There are two types of categorical variables: ordinal and nominal.

Ordinal categorical variables have a logical order, like letter grades.

Nominal categorical variables have no logical order, such as hair color.

Quantitative variables can be discrete or continuous.

Discrete variables are measured in whole numbers, like the number of pets owned.

Continuous variables can take any numerical value, such as weight.

Understanding statistics requires knowing basic definitions like population, sample, and variable.

The course is divided into two parts: descriptive statistics and inferential statistics.

Transcripts

play00:05

what is statistics statistics can be

play00:09

defined as the collection and

play00:10

interpretation of data all around the

play00:12

world we use statistics to measure and

play00:14

analyze variability people have

play00:17

different heights weights hair color

play00:19

food preferences and so on these things

play00:22

are all variable because they change

play00:24

among different individuals there are

play00:26

two kinds of statistics there is

play00:28

inferential statistics and there is

play00:30

descriptive statistics inferential

play00:33

statistics deals with taking a sample

play00:35

and analyzing that sample to make

play00:37

judgments or claims about a population

play00:40

descriptive statistics refers to getting

play00:42

data and talking about it so when you

play00:45

hear a professor say something like the

play00:46

average midterm score was 65% they are

play00:49

using descriptive statistics we often

play00:52

use things like histograms and graphs to

play00:54

help us summarize and explain

play00:56

descriptive statistics the first part of

play00:59

the course deals with descriptive

play01:01

statistics and the second part of the

play01:03

course deals with inferential statistics

play01:05

in order to understand statistics you'll

play01:08

first have to know some basic

play01:09

definitions a population refers to the

play01:13

total amount of things I say things

play01:15

because a population can refer to almost

play01:17

anything

play01:18

this can refer to the total amount of

play01:20

people cats vehicles houses and so on

play01:23

now a sample refers to a small part of

play01:26

the population that is used for study

play01:28

and the total amount of things in a

play01:30

sample is called the sample size in

play01:33

statistics what we examine is a variable

play01:35

it is what we are studying and it can be

play01:37

measureable countable and categorized

play01:39

when we talked about how people can have

play01:42

different heights weights and hair color

play01:44

these are all variables the variables

play01:47

represent a characteristic of what we

play01:49

are trying to study and they can vary

play01:50

among different individuals when we

play01:53

measure a variable our data can come in

play01:55

to two different forms there is

play01:57

categorical data and there is

play01:58

quantitative data quantitative data

play02:01

refers to data that is measured in

play02:03

numbers it deals with numbers that make

play02:06

sense to perform arithmetic calculations

play02:08

with like calculating an average

play02:10

quantitative data comes from

play02:12

quantitative variables examples include

play02:15

height weight and midterm score on the

play02:18

other hand

play02:19

categorical data refers to values that

play02:21

place things into different groups or

play02:23

categories categorical data comes from

play02:26

categorical variables

play02:28

examples include hair color type of cat

play02:30

and letter grade there are actually two

play02:33

types of categorical variables there is

play02:36

categorical and ordinal and categorical

play02:38

and nominal something is set to be

play02:41

categorical and ordinal if there is a

play02:43

logical ordering to the values of a

play02:45

categorical variable a good example of

play02:47

this would be letter grade we can

play02:50

logically order the values of this

play02:51

categorical variable from high to low or

play02:54

from low to high now something is set to

play02:57

be categorical and nominal if there is

play02:59

no logical ordering to the values of a

play03:01

categorical variable an example of this

play03:04

would be hair color depending on our

play03:06

sample we could have people with red

play03:08

hair blond hair brown hair or even blue

play03:11

hair although we can arrange these

play03:13

values in alphabetical order there is no

play03:16

logical ordering with respect to the

play03:18

actual values itself there are also two

play03:22

types of quantitative variables there is

play03:24

discrete and continuous discrete

play03:26

variables refer to variables that can

play03:28

only be measured in certain numbers an

play03:30

example of this is the number of pets

play03:33

you own you can own giro pets one pet

play03:36

two pets or even thirty pets but it's

play03:39

impossible for us to own 2.7 pets in

play03:42

contrast continuous variables refer to

play03:45

variables that can take on any numerical

play03:47

value an example of this would be weight

play03:50

someone can weight 105 pounds 185 pounds

play03:54

or even 170 0.68 3 pounds we can measure

play03:59

this variable in as many decimal places

play04:01

as we want which is why it is classified

play04:03

as a continuous variable

play04:05

so to recap a population refers to the

play04:08

total number of things a sample refers

play04:11

to a small part of the population that

play04:13

we examine and extract information from

play04:15

the total number of things in a sample

play04:18

is called a sample size what we measure

play04:21

from each individual is the variable of

play04:23

interest the way we measure these

play04:25

variables lets us know if the variable

play04:27

is quantitative or categorical for

play04:29

example if her variable of interest was

play04:31

midterm scores first

play04:32

mystics we would have quantitative data

play04:35

if we measure each individual's test

play04:37

score if instead we decide to place

play04:39

people into categories based on letter

play04:41

grade then we would be working with

play04:43

categorical data

Rate This
β˜…
β˜…
β˜…
β˜…
β˜…

5.0 / 5 (0 votes)

Related Tags
StatisticsData AnalysisDescriptiveInferentialPopulationSample SizeVariablesQuantitativeCategoricalData Interpretation