What is the difference between Descriptive Statistics and Inferential Statistics?
Summary
TLDRThis video from 'Psy Versus Psy' demystifies the role of statistics in psychology, focusing on the distinction between descriptive and inferential statistics. Descriptive statistics, such as mean, median, mode, and standard deviation, summarize and describe data, whereas inferential statistics use probability to make inferences about populations. The channel uses an engaging example of a study on natural versus artificial environments to illustrate how these statistical methods help interpret data and answer research questions.
Takeaways
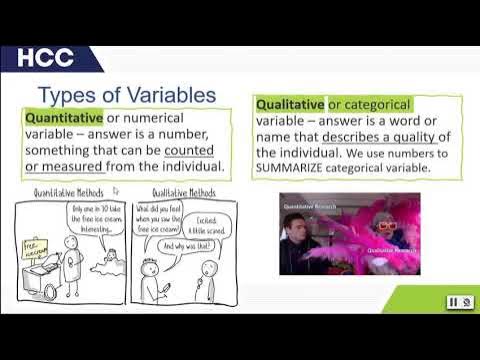
- 📊 Descriptive Statistics: These are used to summarize and describe the data collected from a sample, including measures like averages, medians, modes, variance, standard deviation, minimum, and maximum.
- 🔍 Inferential Statistics: This type of statistics uses descriptive statistics and probability theory to make inferences about a population from sample data, determining if observed differences are significant or due to random chance.
- 🌿 Example Study: The script discusses a hypothetical study comparing preferences and stress levels in natural versus artificial environments using measures like usage and salivary cortisol levels.
- 🧪 Salivary Cortisol: The study example mentions using saliva samples to measure cortisol, a stress hormone, to assess stress levels in different environments.
- 📝 Data Analysis: The script explains the process of analyzing data, starting with descriptive statistics to understand the sample before moving to inferential statistics to make conclusions about the population.
- 📉 Statistical Tests: It mentions various inferential statistical tests such as t-tests, ANOVAs, chi-squared tests, correlations, and regressions that are used to analyze differences and relationships in data.
- 🎯 Key to Inferential Statistics: The presence of measures of probability like p-values or Bayes factors indicates inferential statistics, which go beyond describing the data to make inferences about the population.
- 🔑 Making a Determination: To identify if a statistic is descriptive or inferential, one should look for measures of probability and whether the statistic is making comparisons or drawing conclusions about the population.
- 🤔 Understanding Statistics: The script aims to demystify statistics, emphasizing their importance in psychological research and the scientific process.
- 🔑 Importance of Both Types: Both descriptive and inferential statistics are crucial for understanding and interpreting data in psychology studies.
- 👍 Encouragement: The video script encourages viewers to engage with the content by liking and subscribing for more psychology-related videos.
Q & A
What is the main topic of the video script?
-The main topic of the video script is the difference between descriptive statistics and inferential statistics, with an example related to the preference for natural versus artificial environments and their impact on stress levels.
Why are statistics important in psychology research?
-Statistics are important in psychology research because they are a crucial part of the scientific method, helping to analyze and interpret data, and to make inferences about populations based on sample data.
What is an example of a natural environment used in the script?
-An example of a natural environment used in the script is an outdoor area with tables and chairs surrounded by plants and vegetation where people can eat their lunch.
What psychological literature evidence is mentioned in the script regarding natural environments?
-The script mentions evidence from psychological literature that suggests people have a preference for natural environments over artificial ones and that exposure to natural environments can reduce stress.
What is the role of descriptive statistics in the given research example?
-Descriptive statistics in the research example are used to summarize and describe the data collected, such as the average number of people visiting each location per day, the median, mode, and standard deviations of visitor numbers.
What is the purpose of inferential statistics in the context of the research?
-The purpose of inferential statistics in the context of the research is to determine whether the observed differences between the natural and artificial environments are statistically significant and not just due to random chance.
What is an example of an inferential statistical test mentioned in the script?
-An example of an inferential statistical test mentioned in the script is the t-test, which can be used to compare the usage of the two sites over the week.
How does the script differentiate between descriptive and inferential statistics?
-The script differentiates between descriptive and inferential statistics by stating that descriptive statistics describe the sample data, while inferential statistics use probability measures and reasoning to make inferences about the population.
What is the significance of cortisol levels in the research example?
-Cortisol levels are significant in the research example because they are a measure of stress hormones, and any differences in cortisol levels between the natural and artificial environments can indicate differences in stress levels.
What are some key indicators that a statistic is inferential according to the script?
-According to the script, key indicators that a statistic is inferential include the presence of measures of probability like p-values or Bayes factors, and whether the statistic is making comparisons or drawing conclusions about populations beyond the sample data.
How does the script suggest enhancing the understanding of statistics?
-The script suggests enhancing the understanding of statistics by demystifying some of the concepts that may initially seem intimidating and by providing clear examples and explanations of how these statistics are used in research.
Outlines

This section is available to paid users only. Please upgrade to access this part.
Upgrade NowMindmap

This section is available to paid users only. Please upgrade to access this part.
Upgrade NowKeywords

This section is available to paid users only. Please upgrade to access this part.
Upgrade NowHighlights

This section is available to paid users only. Please upgrade to access this part.
Upgrade NowTranscripts

This section is available to paid users only. Please upgrade to access this part.
Upgrade NowBrowse More Related Video

Berkenalan dengan Statistika

KUPAS TUNTAS: Apakah Perbedaan Statistik Inferensial dengan Statistik Deskriptif ?

Inferential Statistics FULL Tutorial: T-Test, ANOVA, Chi-Square, Correlation & Regression Analysis
PERBEDAAN STATISTIK DESKRIPTIF DAN INFERENSIAL
What is Statistics?

Quantitative Data Analysis 101 Tutorial: Descriptive vs Inferential Statistics (With Examples)
5.0 / 5 (0 votes)