Macro 1.2 - Production Possibilities Curve - NEW!
Summary
TLDRIn this video, we explore the foundational economic model known as the Production Possibilities Curve (PPC). The PPC illustrates the trade-offs and opportunity costs an economy faces when deciding between two goods, typically capital and consumer goods. The curve helps visualize concepts like scarcity, efficiency, and economic growth. Different shapes of the PPC—linear, concave, and convex—represent constant, increasing, and decreasing opportunity costs respectively. The host uses engaging examples and clear explanations to demystify these important economic principles. Be sure to like, subscribe, and check the description for helpful study aids and practice questions.
Takeaways
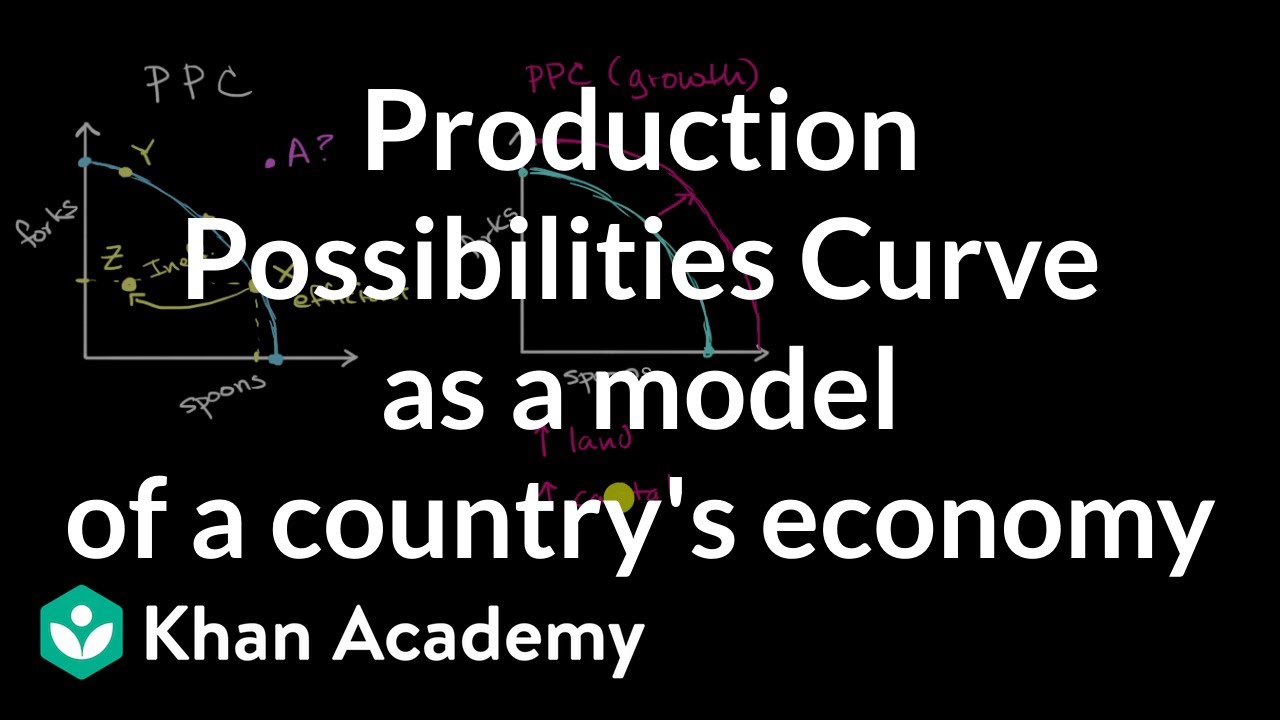
- 📉 The production possibilities curve (PPC) is a fundamental model in economics that illustrates the maximum possible output combinations of two goods that an economy can produce.
- 📊 The PPC is used in both microeconomics and macroeconomics to demonstrate concepts such as scarcity, opportunity cost, and trade-offs.
- ⚖️ Scarcity necessitates choices; producing more of one good requires sacrificing the production of another.
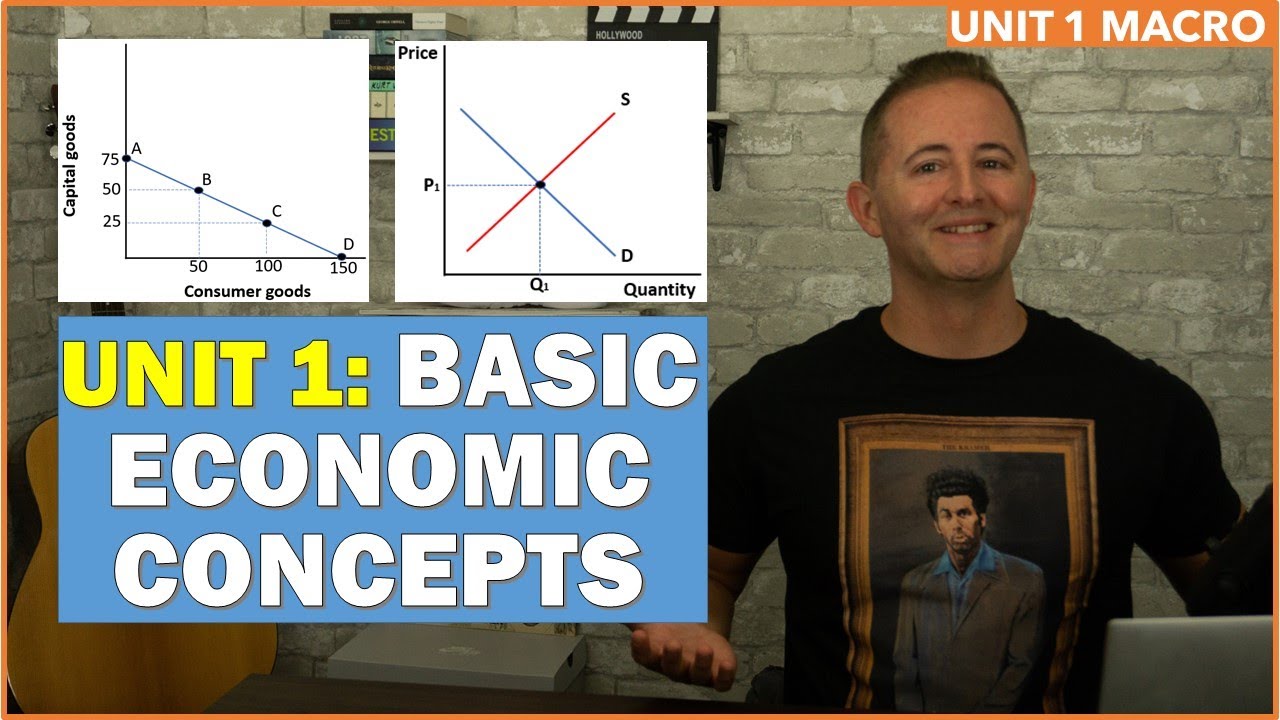
- ↔️ The PPC can show different combinations of two goods (e.g., capital goods and consumer goods) that an economy can produce efficiently.
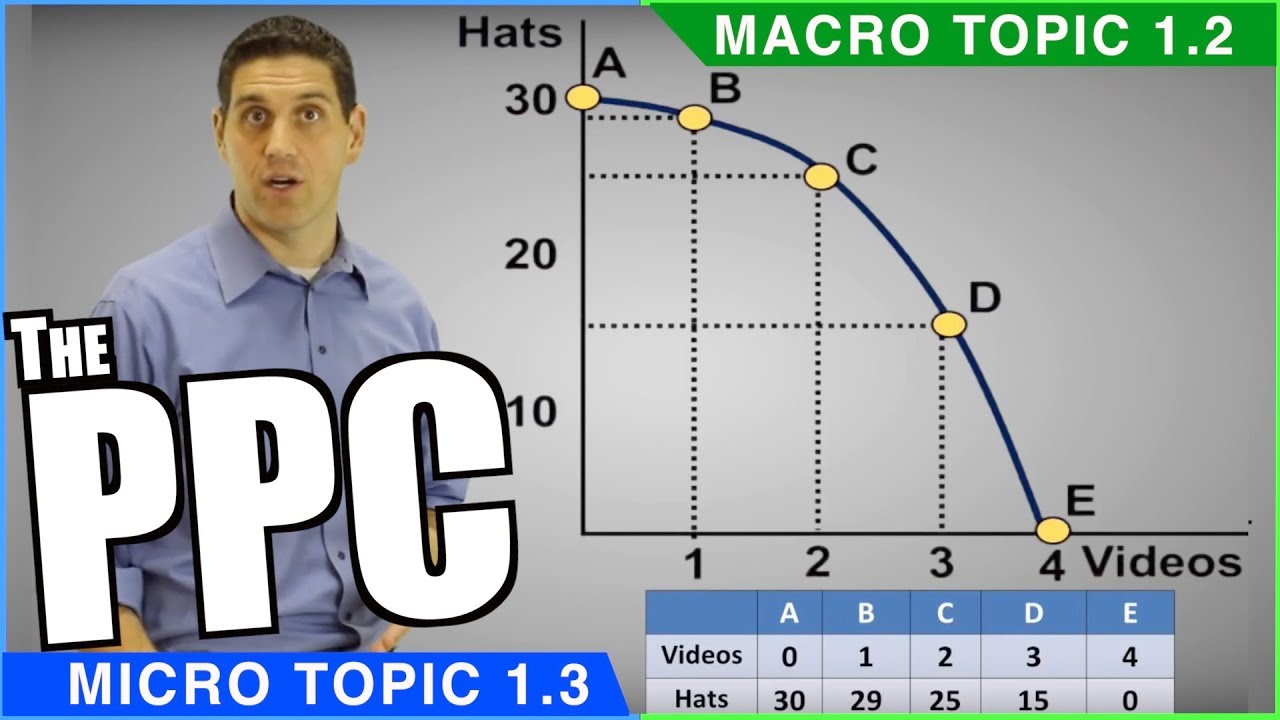
- 🔄 Moving along the PPC demonstrates opportunity costs; for example, increasing consumer goods production involves reducing capital goods production.
- ⚙️ Efficiency is represented by any point on the PPC, where all resources are fully utilized. Points inside the PPC indicate underutilized resources, and points outside are unattainable with current resources.
- 📈 Economic growth shifts the PPC outward, allowing higher production of both goods, while economic contraction shifts it inward, reducing production capabilities.
- 🔧 Technological advancements and better education can increase productivity, contributing to economic growth and an outward shift of the PPC.
- 📉 The shape of the PPC (linear, concave, convex) indicates the nature of opportunity costs—constant, increasing, or decreasing, respectively.
- 🍕 Real-world examples like producing computers and pizza help illustrate the concept of opportunity costs and how the PPC can model different economic scenarios.
Q & A
What is the Production Possibilities Curve (PPC)?
-The Production Possibilities Curve (PPC) is a simplified model used in economics to illustrate the possible combinations of two goods that can be produced with the available resources, given the current level of technology and factors of production.
Why is the PPC important in both microeconomics and macroeconomics?
-The PPC is important in both microeconomics and macroeconomics because it helps to illustrate the concepts of scarcity, opportunity cost, and the trade-offs that must be made in the allocation of resources between different types of goods.
What are the two goods typically represented on the PPC?
-The two goods typically represented on the PPC are capital goods and consumer goods, with capital goods usually placed on the vertical or y-axis and consumer goods on the horizontal or x-axis.
What does the downward sloping line of the PPC represent?
-The downward sloping line of the PPC represents the outer limit of what is currently possible for an economy or a person to produce, given the constraints of resources and technology.
What is scarcity and how is it depicted on the PPC?
-Scarcity refers to the limited availability of resources in relation to unlimited wants and needs. On the PPC, scarcity is depicted by the fact that it is not possible to produce an infinite amount of both capital and consumer goods, hence choices must be made.
What is the concept of opportunity cost as it relates to the PPC?
-Opportunity cost is the cost of forgoing the next best alternative when making a choice. In relation to the PPC, it is the amount of one good that must be given up to produce more of another good, as seen when moving from one point on the curve to another.
What does it mean if the economy is operating inside the PPC?
-If the economy is operating inside the PPC, it means that there are underutilized resources, which indicates inefficiency. There is potential to produce more of both goods without sacrificing one for the other.
How does economic growth affect the PPC?
-Economic growth, which can result from an increase in factors of production such as land, labor, capital, better technology, or a better educated workforce, causes the PPC to shift outward to the right, making previously unattainable combinations of goods possible.
What factors could cause the PPC to shift inward?
-The PPC could shift inward if there is a significant decrease in one or more factors of production, such as widespread destruction of natural resources or loss of life due to war or disaster, which would reduce the economy's production capacity.
What determines the shape of the PPC?
-The shape of the PPC is determined by whether the opportunity costs are constant, increasing, or decreasing. A linear PPC represents constant opportunity costs, a concave PPC represents increasing opportunity costs, and a convex PPC represents decreasing opportunity costs.
Why might a concave PPC represent increasing opportunity costs?
-A concave PPC represents increasing opportunity costs because as resources that are particularly suited to one good are diverted to produce another, the opportunity cost of doing so increases. This could be due to the specialized nature of the resources or the skills of the workforce.
Outlines
📈 Introduction to the Production Possibilities Curve (PPC)
This paragraph introduces the concept of the Production Possibilities Curve (PPC), a fundamental model in economics used to illustrate the potential output combinations of two goods given limited resources. The video emphasizes the PPC's role in both micro and macroeconomics and explains its basic structure: capital goods on the y-axis and consumer goods on the x-axis, with a downward-sloping line indicating the limits of current production capabilities. Key economic concepts such as scarcity, opportunity cost, and trade-offs are reintroduced, highlighting that choices must be made due to resource limitations. The paragraph also touches on the implications of operating at different points on the PPC, including the idea of efficiency and the consequences of underutilized resources or economic growth.
🔍 Deep Dive into PPC Dynamics: Opportunity Costs and Economic Growth
The second paragraph delves deeper into the dynamics of the PPC, discussing the opportunity costs associated with moving between different production points. It provides a clear example of how the opportunity cost is calculated when transitioning from producing 75 capital goods to 25, in exchange for an increase in consumer goods production. The paragraph further explains the significance of the PPC's position relative to efficiency, with points on the curve representing efficient production and points inside indicating inefficiency due to underutilized resources. It also addresses how economic growth can shift the PPC outward, making previously unattainable production combinations possible through increased factors of production, such as natural resources, technology, and a better-educated workforce. Conversely, it mentions how a contraction in the economy, possibly due to a war or disaster, could shift the PPC inward. The paragraph concludes by discussing the different shapes of the PPC, which can be linear (constant opportunity costs), concave (increasing opportunity costs), or convex (decreasing opportunity costs), and what these shapes imply about the relationship between the goods being produced.
Mindmap
Keywords
💡Production Possibilities Curve (PPC)
💡Scarcity
💡Opportunity Cost
💡Trade-offs
💡Efficiency
💡Underutilized Resources
💡Economic Growth
💡Productivity
💡Concave PPC
💡Convex PPC
💡Linear PPC
Highlights
Introduction to the Production Possibilities Curve (PPC), a fundamental economic model.
The PPC is used in both micro and macroeconomics to understand the limits of what an economy can produce.
Assumption of the PPC model is that an economy can only produce two goods: capital goods and consumer goods.
The PPC is represented by a downward sloping line, indicating the outer limit of current production possibilities.
Scarcity is addressed as a concept within the PPC, as resources are limited and choices must be made.
Trade-offs are inherent in the PPC, where producing more of one good means producing less of another.
The opportunity cost is explained as the cost of producing more of one good by producing fewer of another.
Efficiency in the PPC is defined as society getting the most out of its scarce resources.
Points inside the PPC indicate underutilized resources and inefficiency.
Economic growth can shift the PPC outward, making previously impossible combinations possible.
Factors of production, such as land, labor, and capital, contribute to economic growth and PPC expansion.
Decreases in factors of production can cause the PPC to shift inward, indicating economic contraction.
The shape of the PPC matters, as it can be linear, concave, or convex, reflecting different opportunity costs.
A linear PPC represents constant opportunity costs, regardless of the production level.
A concave PPC indicates increasing opportunity costs as production of one good increases.
A convex PPC suggests decreasing opportunity costs, which is rare and involves more complex economic concepts.
The video concludes with a summary of the PPC's significance and practical applications in economics.
Transcripts
hey everybody welcome back in this video we're gonna dive into the first
model we learn in economics the production possibilities curve
be sure to hit that like button and subscribe as you enjoy that funky music
all right so we do a lot of graphing and modeling and economics
no not that kind of modeling god no we like to draw graphs that are simplified models of human
behavior and economies and the very first one is known as the production possibilities curve
or the ppc and we use this in both micro and macroeconomics so it has applications in both
courses the idea behind the ppc is that we're seeing what is possible foreign economy to produce
just like the name implies and good news one of the simplifying assumptions we're gonna make for
this model is that we can only produce two goods in this case we'll say capital goods and consumer
goods so we'll put capital goods on our vertical or y-axis and consumer goods on the horizontal or
x-axis and for this version of the ppc we have a downward sloping line going from one axis to
the other this curve represents the outer limit of what is currently possible for the economy or the
person to produce notice that they can produce at a maximum 100 capital goods or 200 consumer goods
here's where some of the concepts from the first video are going to come back into play remember
scarcity opportunity cost trade-offs they're all here on this model let's start with scarcity
because of the limited nature of resources it isn't possible to produce an infinite amount
of capital and consumer goods so choices have to be made if this economy decides to maximize
its production of capital goods it can produce 100 of them but notice that they'll be producing
zero consumer goods at the other extreme they can use all their resources to produce 200 consumer
goods but then they'll have zero capital goods or they can produce some combination in between
like 50 capital goods and 100 consumer goods and that's essentially the idea of trade-offs isn't
it if they're operating on the ppc and want to produce more consumer goods the only way to do
that is to produce fewer capital goods and if they want to produce more capital goods
then guess what they'll have to produce fewer consumer goods now let's be even more specific
suppose that we move from point a to point b we gain 100 consumer goods we had 50 and now we
have 150 right well what's the opportunity cost in other words what did we give up
we were making 75 capital goods and now we're only making 25. so the opportunity cost of moving from
a to b is 50 capital goods so that's one thing that ppc does for us but it also displays the
concepts of efficiency under utilized resources as well as economic growth or contraction i'm
going to define efficiency as society getting the most it can out of its scarce resources on the ppc
any point along the ppc is a point of efficiency since it isn't possible to make more of one good
without giving up some of the other now notice that we're not making any judgments about what
combination of capital and consumer goods we think should be produced but rather all
we're saying is simply what it is possible to currently produce if our economy is operating
anywhere inside of the ppc this means it has under utilized resources and this is inefficient
look at point c it's possible for them to produce more of both capital and consumer goods this means
that there are resources available that are not being used for one reason or another on the other
hand any point outside the ppc is not currently a possible combination of goods that can be produced
but it is possible that that combination can be produced in the future as a result of economic
growth economic growth is the result of an increase in our factors of production so if
land labor capital increases the possibilities of what can be produced in our economy will
also increase this means more natural resources more machinery better tools better technology
a better educated workforce will all cause our ppc to shift outward to the right meaning that
those combinations that aren't currently possible can become possible in the future additionally
increases in technology and productivity cause economic growth productivity refers to how much
a worker can produce so if workers are better educated or have more access to better technology
and machinery then those workers will be more productive on the other hand it's possible
that the ppc could shift inward if there was a significant decrease in one or more of our factors
of production for example if a war or disaster led to widespread destruction of a natural resource or
loss of life well we wouldn't be able to produce as much and this would cause a contraction of the
economy shifting the ppc inward to the left the last thing i want to share with you is that the
shape of the ppc matters so far i've shown you a linear or downward sloping pvc but the ppc
can also be concave bowed outward or convex bowed inward everything that we've done to this point is
true regardless of the shape of the ppc so i just want you to know that everything about scarcity
opportunity cost and economic growth they can be done on any of these ppc shapes what
determines the shape of the ppc is whether opportunity costs are constant increasing or
decreasing so let's start with our first ppc our linear ppc represents constant opportunity costs
notice that when we go from a to b our opportunity cost is 25 capital goods when we go from b to c
it's still 25 capital goods and when we go from c to d well yeah you guessed it
25 capital goods on the other hand notice what happens on our concave or bowed outward ppc this
ppc represents increasing opportunity cost from a to b the opportunity cost is 10 capital goods
from b to c though it's 15 capital goods and if we go from c to d it's even higher 50 capital goods
so what's happening here well the resources that are really useful for making one good
might not be very useful for making the other let's make this computers and pizza and i think
you'll see what i mean at point a we're making only computers so all workers are making computers
now let's say we decide that we also want to produce some pizza now you'd probably pick
your very best pizza chefs wouldn't you and you'd switch them over from computer to pizza production
so when we move from point a to point b we have a large increase in the amount of pizza produced
and a relatively small loss in computers but what if we go from point c to d true we make even more
pizza but notice that the gain is pretty small and the opportunity cost was relatively large number
of computers well why is that when we were at point c you probably had your very best engineers
making computers and they were really good at it now you move them off computer production and
there's going to be a large drop-off or a large cost in the loss of computers with a comparatively
small gain in pizza production that's increasing opportunity costs there is a third possibility one
that's probably the least common in the real world and on the ap exam as well and that's
decreasing opportunity costs so we have a convex or bowed inward ppc this is literally the opposite
of the previous one the more consumer goods we produce the fewer capital goods we have to give up
now while this is possible it's extremely rare and honestly to explain the logic behind it we
need to go into more detail about other concepts that we haven't learned yet so
for now you'll be fine just understanding what this graph would look like and knowing that it
involves a reduction in opportunity cost as more of a good is produced okay take a deep breath you
made it i know there was a lot there but until next time this has been a la money production
thanks again for watching this video and make sure to like it if you didn't already be sure to check
out the description for links to the answers to these practice questions and some of the great
study aids i have for you like economics in 250 words i promise you'll love it see you next time
Ver Más Videos Relacionados
Production Possibilities Curve- Macro Topic 1.2 (Micro Topic 1.3)
(3/3) The Production Possibilities Frontier – Economic Lowdown
Shifts in the Production Possibilities Curve
(1/3) The Production Possibilities Frontier – Economic Lowdown
Eco 155: Principles of Macroeconomics Class 5
Opportunity cost and PPF's
5.0 / 5 (0 votes)